Copyright
©The Author(s) 2017.
World J Gastroenterol. Oct 14, 2017; 23(38): 6973-6982
Published online Oct 14, 2017. doi: 10.3748/wjg.v23.i38.6973
Published online Oct 14, 2017. doi: 10.3748/wjg.v23.i38.6973
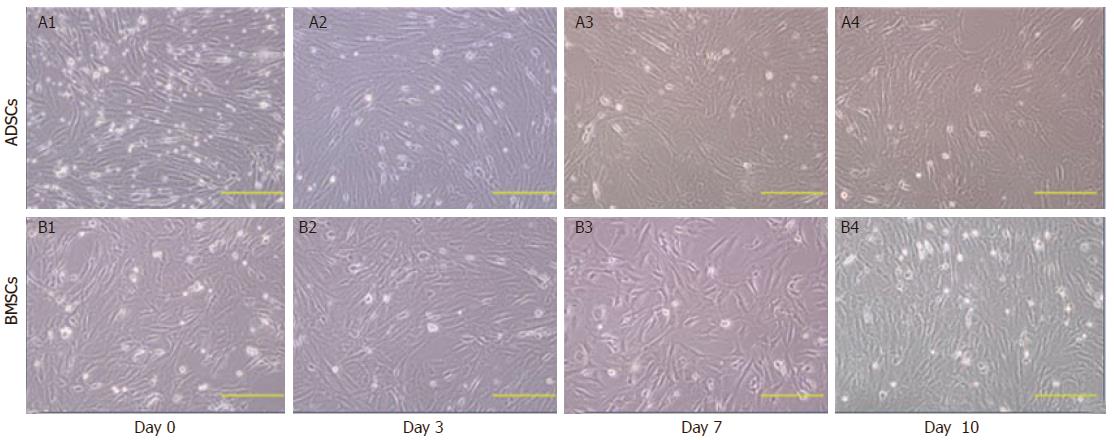
Figure 1 Morphological changes of adipose-derived stromal cells and bone marrow stromal cells following hepatic differentiation.
After hepatic differentiation, the cellular morphology changed gradually and, on day 10 after differentiation, the induced cells were polygonal in shape. ADSCs: Adipose-derived stromal cells; BMSCs: Bone marrow stromal cells.
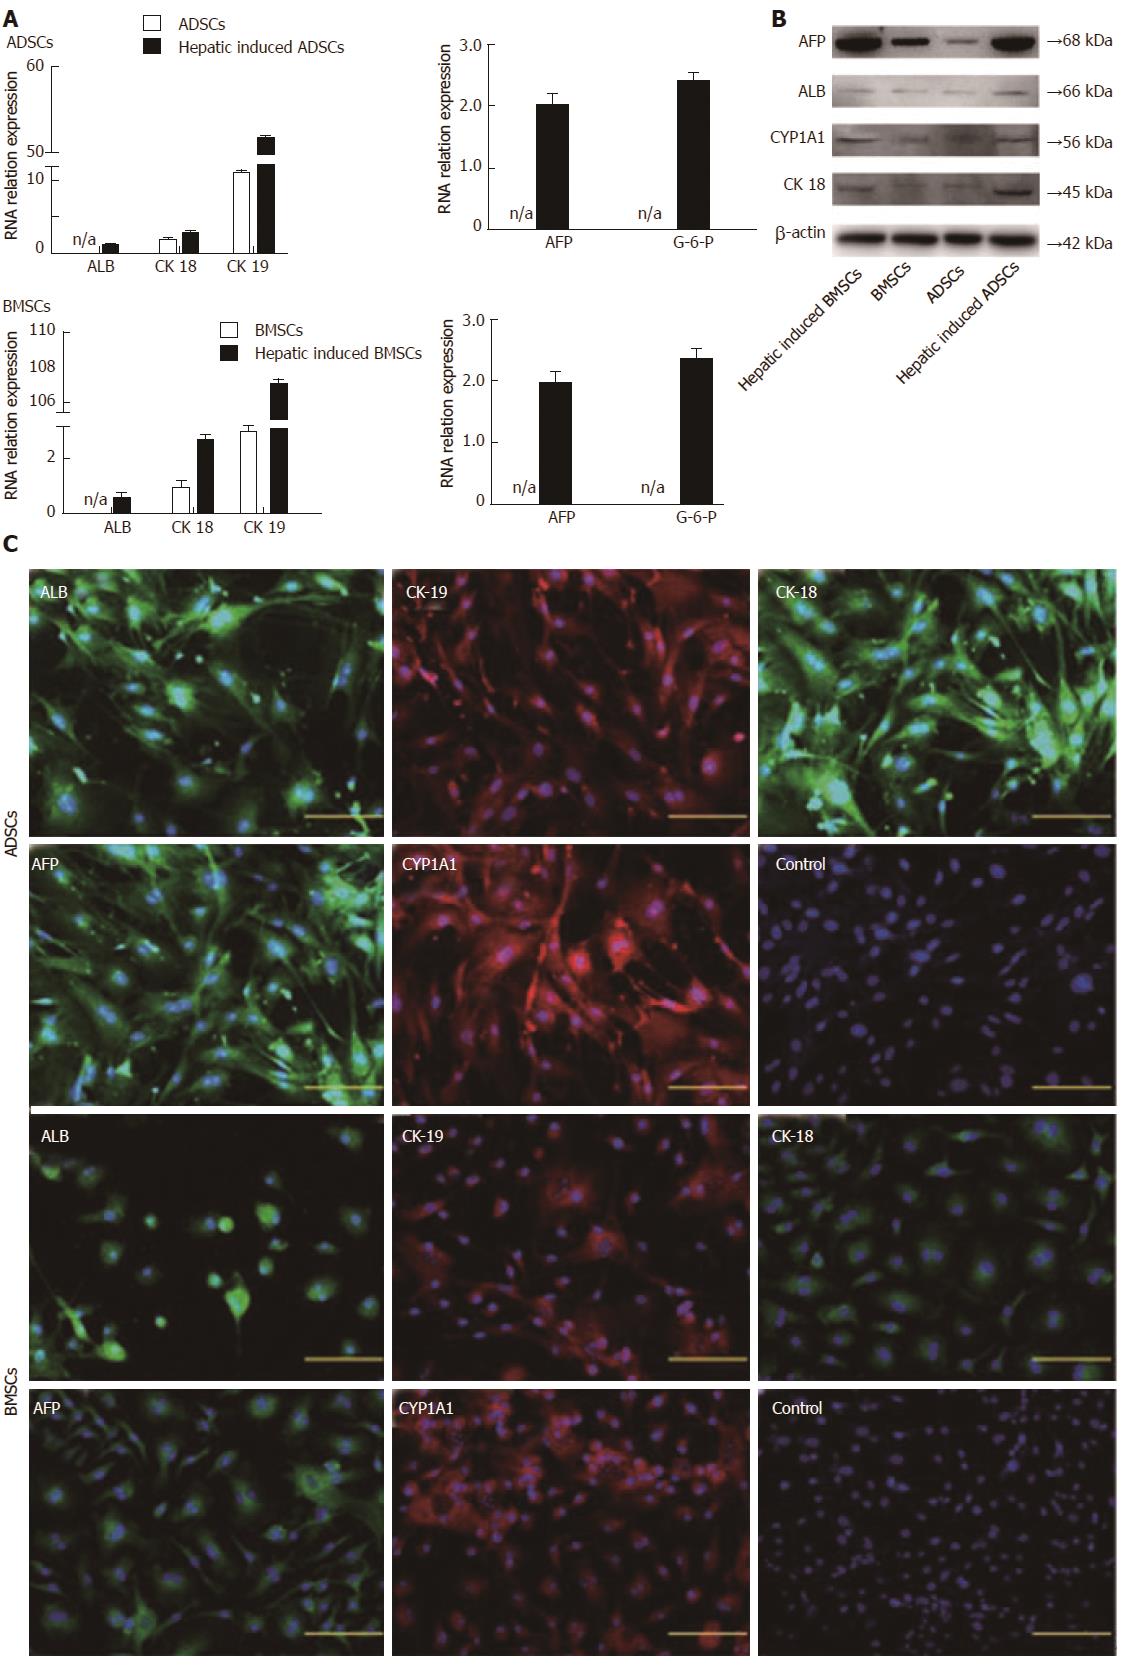
Figure 2 RT-PCR, western blot analysis and immunofluorescence staining of hepatocyte-related markers following hepatic induction.
A: Gene expression of albumin (ALB), alpha fetoprotein (AFP), cytokeratin 18 (CK-18), CK-19, and glucose-6-phosphate (G-6-P) was significantly enhanced in hepatocyte-like cells on day 10 following hepatic differentiation. Undifferentiated cells served as a negative control; B: Western blot analysis of hepatocyte-related markers in adipose-derived stromal cells (ADSCs), bone marrow stromal cells (BMSCs), and hepatocyte-like cells; C: Immunofluorescence staining of hepatocyte-related markers in ADSCs, BMSCs, and hepatocyte-like cells. On day 10 after differentiation, immunofluorescence staining revealed that the differentiated hepatocyte-like cells expressed the hepatocyte markers ALB, CK-19, CK-18, AFP and CYP1A1. Scale bar: 200 μm.
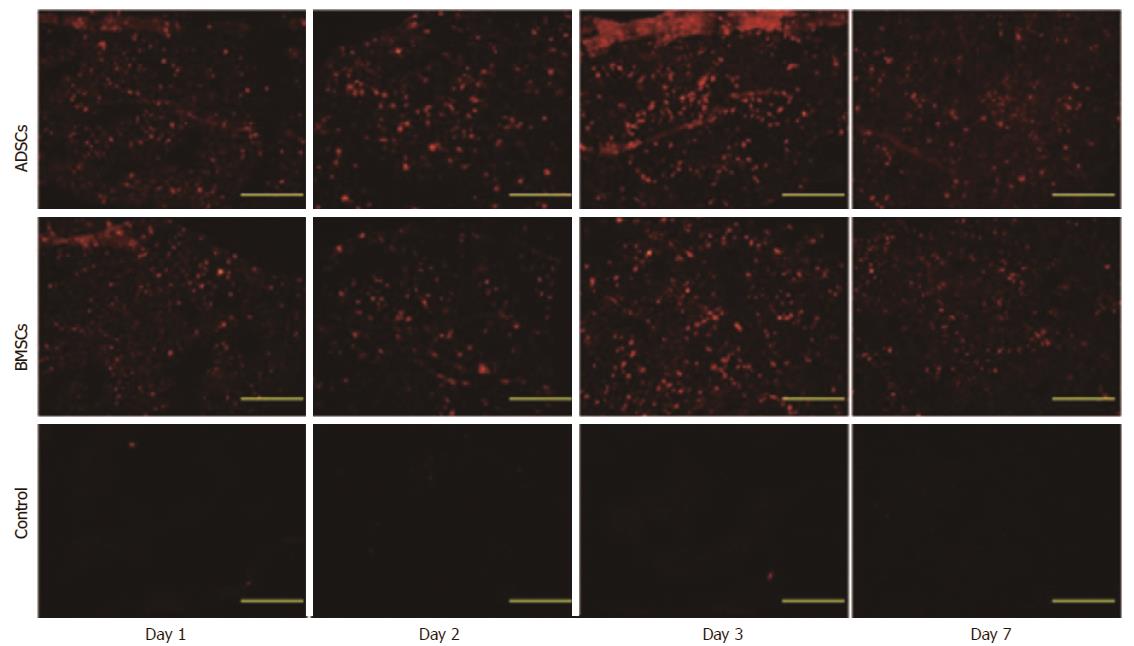
Figure 3 Tracing transplanted cells in a mouse model of acute liver failure.
Red fluorescent cells were detected in the injured livers under fluorescence microscopy on days 1, 2, 3 and 7 following the transplantation. ADSCs: Adipose-derived stromal cells; BMSCs: Bone marrow stromal cells.
Figure 4 Analysis of liver function in CCl4-treated mice following mesenchymal stem cell transplantation.
Comparison of alanine aminotransferase (ALT) and aspartate aminotransferase (AST) levels in the experimental and CCl4 groups. Hepatic function nearly recovered on day 7 (aP < 0.05 compared to the CCl4 group). ADSCs: Adipose-derived stromal cells; BMSCs: Bone marrow stromal cells.
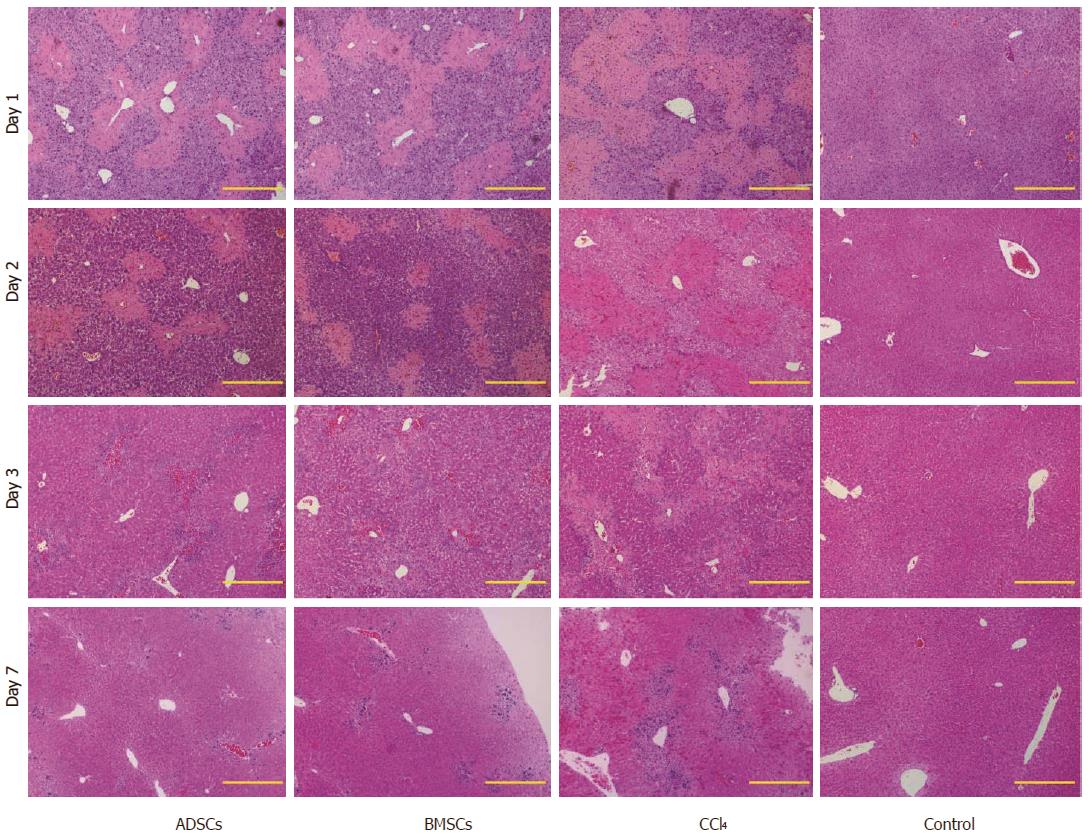
Figure 5 Hematoxylin and eosin staining in CCl4-treated mice following mesenchymal stem cells transplantation.
HE staining of liver tissue on different days following MSC transplantation (100 × magnification). The MSC groups showed smaller congested areas than the CCl4 group. ADSCs: Adipose-derived stromal cells; BMSCs: Bone marrow stromal cells; HE: Hematoxylin and eosin; MSC: Mesenchymal stem cells; Scale bar: 200 μm.
- Citation: Xu LJ, Wang SF, Wang DQ, Ma LJ, Chen Z, Chen QQ, Wang J, Yan L. Adipose-derived stromal cells resemble bone marrow stromal cells in hepatocyte differentiation potential in vitro and in vivo. World J Gastroenterol 2017; 23(38): 6973-6982
- URL: https://www.wjgnet.com/1007-9327/full/v23/i38/6973.htm
- DOI: https://dx.doi.org/10.3748/wjg.v23.i38.6973


