Copyright
©The Author(s) 2017.
World J Gastroenterol. Sep 28, 2017; 23(36): 6639-6649
Published online Sep 28, 2017. doi: 10.3748/wjg.v23.i36.6639
Published online Sep 28, 2017. doi: 10.3748/wjg.v23.i36.6639
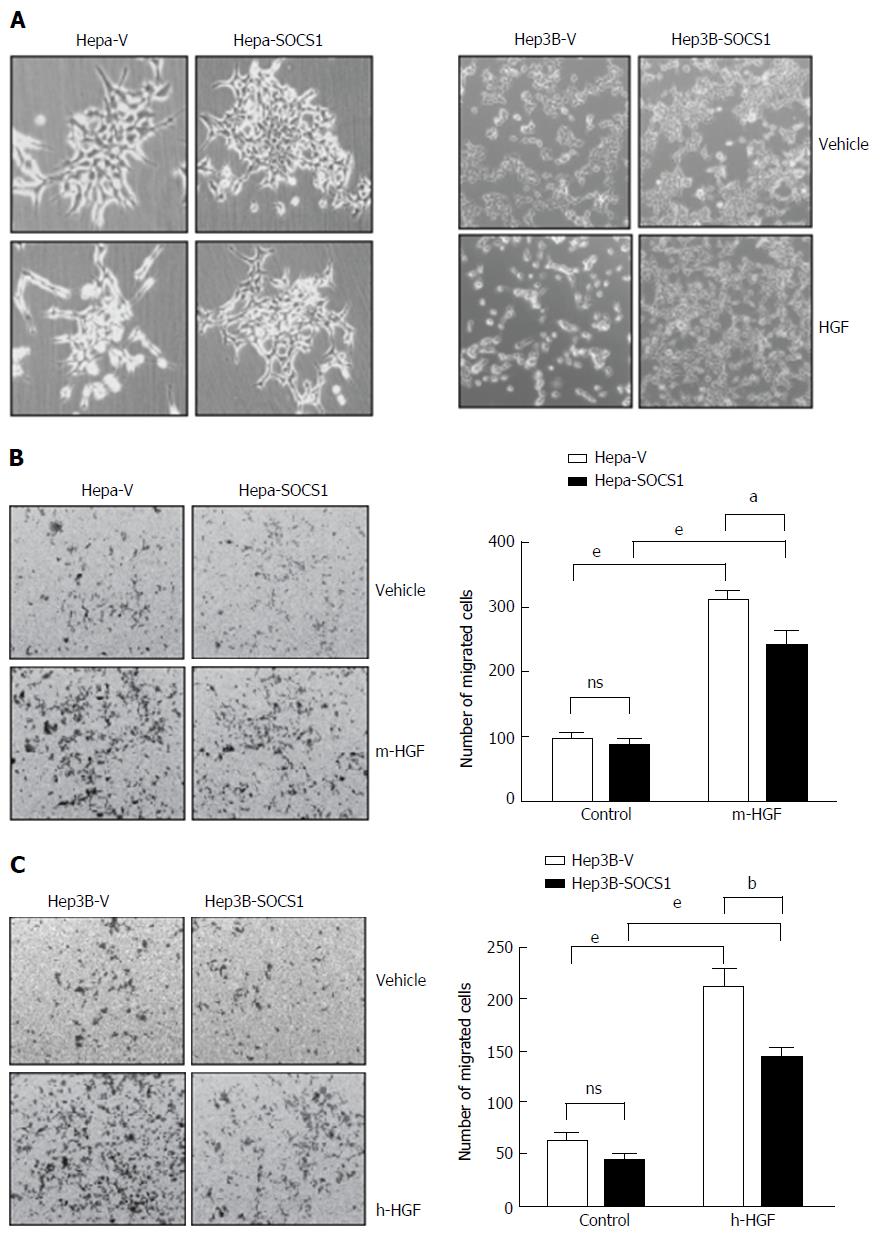
Figure 1 Suppressor of cytokine signaling 1 attenuates hepatocyte growth factor-induced scattering and migration of hepatocellular carcinoma cells.
A: Hepa and Hep3B cells expressing SOCS1 (Hepa-SOCS1, Hep3B-SOCS1) or control vector (Hepa-V, Hep3B-V) were grown to less than 50% confluent state, starved in serum-free medium for 16 h and exposed to murine or human HGF (HGF, 25 ng/mL), respectively. After 48 h, the culture plates were examined by phase contrast microscopy to visualize HGF-induced cell scattering; B: Hepa-SOCS1 and Hepa-V cells were seeded onto Matrigel-coated trans-well migration chambers, and migration towards m-HGF was evaluated after 48 h. Representative images of cells that had migrated across the membrane and the number of migrated cells in five random fields from three separate experiments (mean ± SE) are shown; C: Migration of Hep3B cells expressing SOCS1 (Hep3B-SOCS1) or control vector (Hepa-V) towards human HGF (h-HGF, 10 ng/mL). aP < 0.05, bP < 0.01,eP < 0.001. SOCS1: Suppressor of cytokine signaling 1.
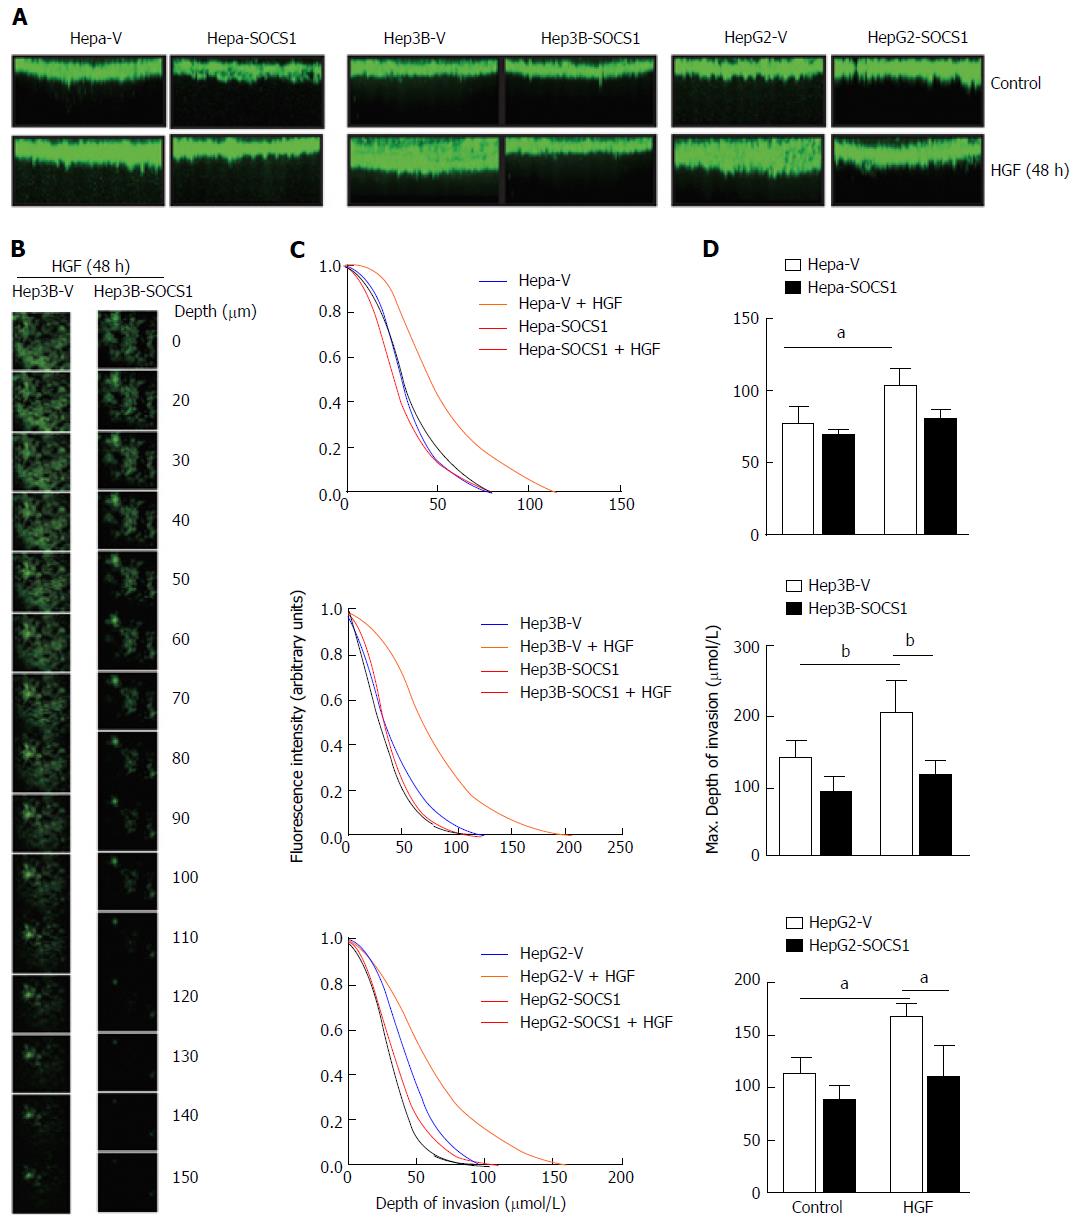
Figure 2 Inhibition of hepatocyte growth factor-induced invasion of collagen matrix by suppressor of cytokine signaling 1 in hepatocellular carcinoma cells.
Hepa-V and Hepa-SOCS1, Hep3B-V and Hep3B-SOCS1, and HepG2-V and HepG2-SOCS1 cell lines were evaluated for their ability to invade collagen matrix in a 3-D invasion assay in the presence or absence of mouse HGF (25 ng/mL for Hepa cells) or human HGF (30 ng/mL for Hep3B, HepG2 cells). After 48 h, cells were fluorescently labeled with calcein Green, fixed and examined by confocal microscopy. A: The reconstructed cross-sectional images of cell migration, representative of two independent experiments, are shown; B: Representative images of Hep3B-V and Hep3B-SOCS1 cells migrated to different planes of the collagen-agarose matrix along the z-axis; C: Efficiency of migration (ratio of the fluorescence intensity at each 5 μm layer over the fluorescence intensity of the non-invaded cells at the top 5 μm); D: Maximum depth of invasion by control and SOCS1-expressing cells in the absence or presence of HGF. aP < 0.05, bP < 0.01. SOCS1: Suppressor of cytokine signaling 1.
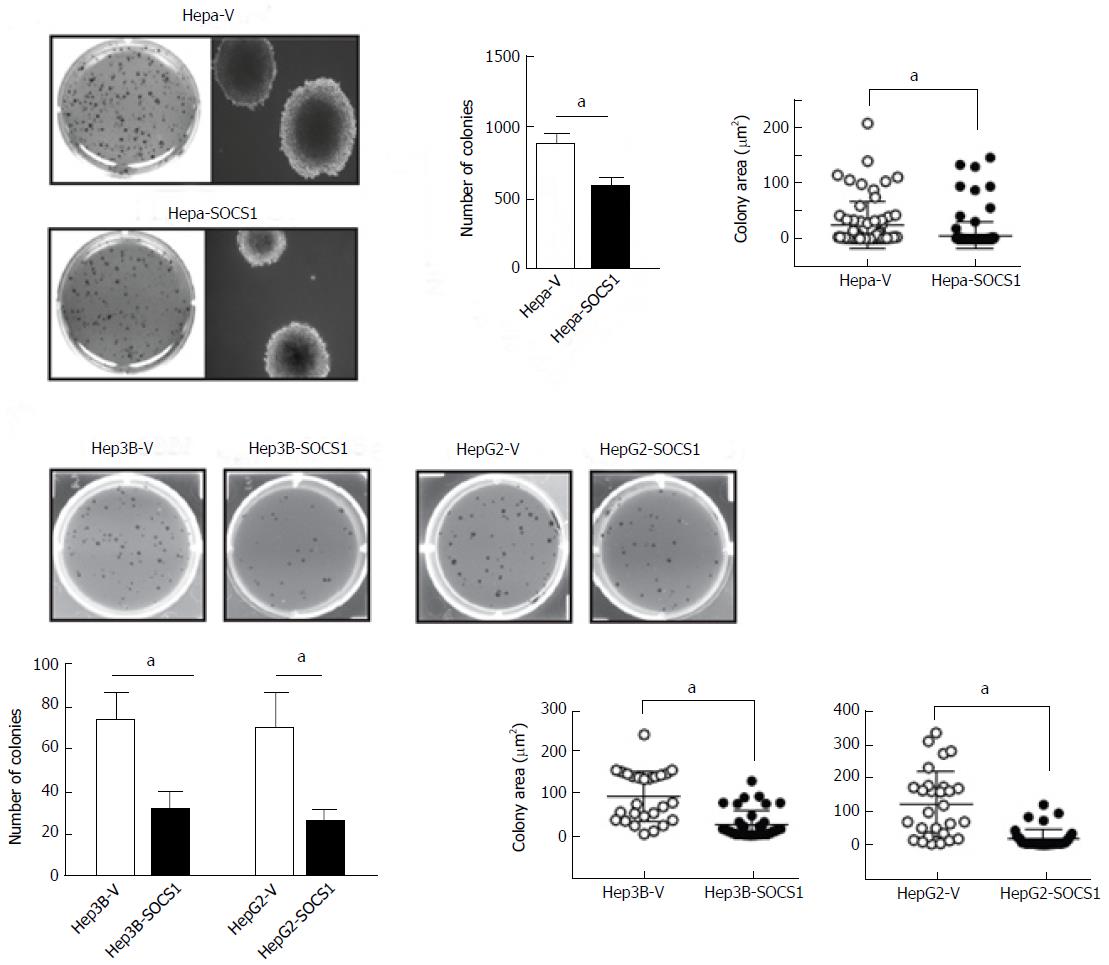
Figure 3 Reduced anchorage-independent proliferation of hepatocellular carcinoma cells expressing suppressor of cytokine signaling 1.
SOCS1-expressing and control mouse Hepa (A) and human Hep3B and HepG2 (B) HCC cell lines were evaluated for their ability to form colonies in soft agar. After 3 wk culture, the colonies were photographed, and the number and size of colonies (area; mean ± SE) were evaluated from triplicates of two separate experiments. aP < 0.05. SOCS1: Suppressor of cytokine signaling 1.
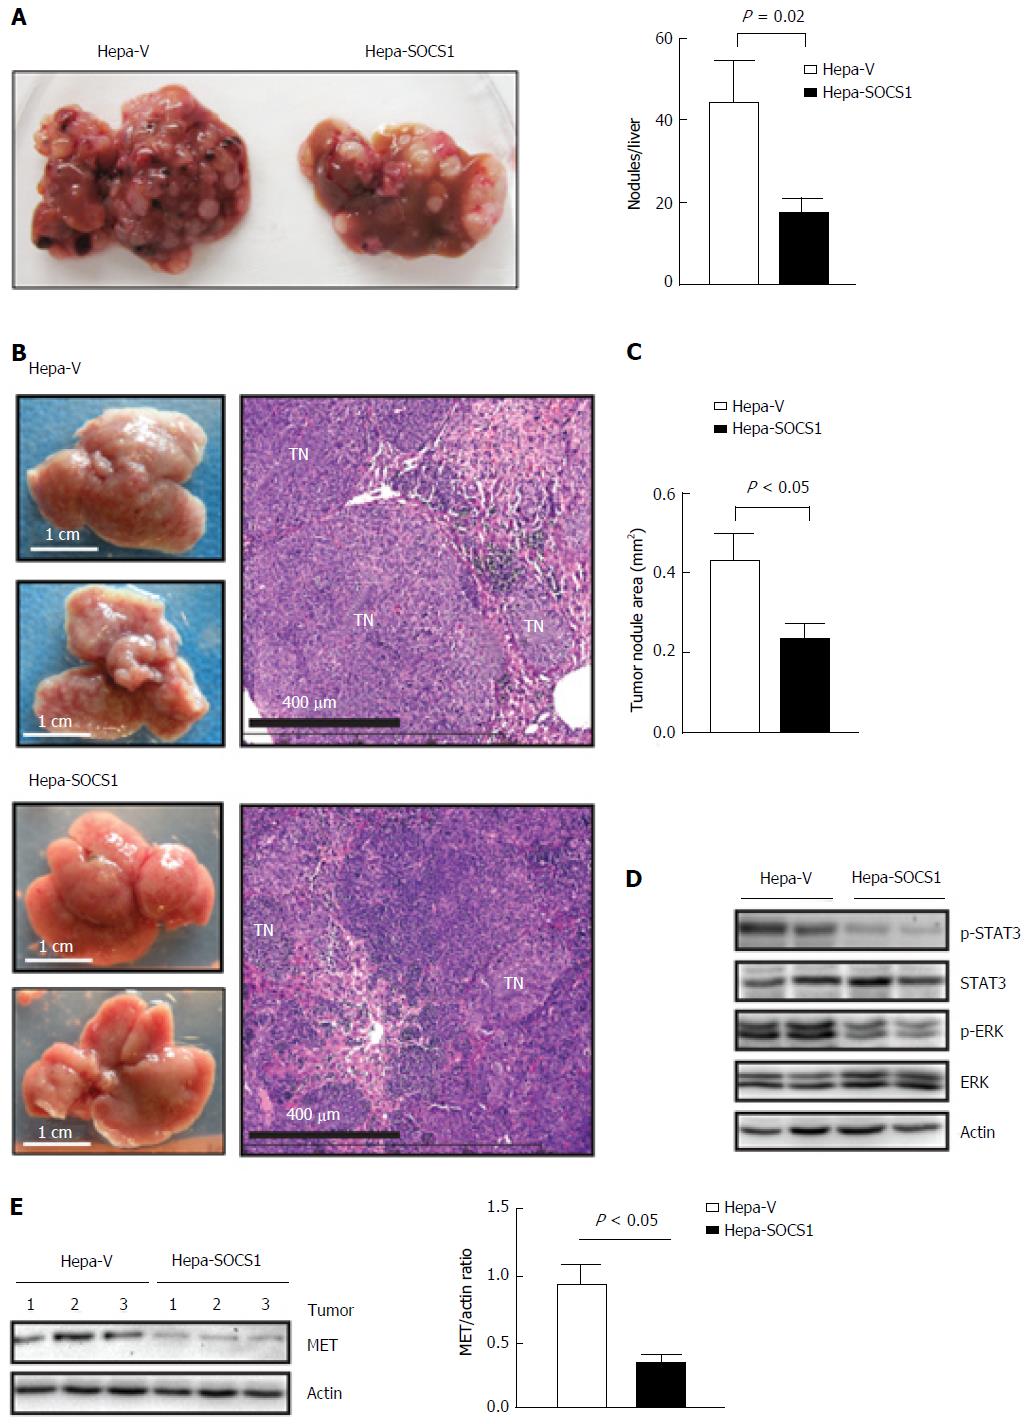
Figure 4 Suppressor of cytokine signaling 1 attenuates invasive growth of orthotopic Hepa cell tumors.
A: Hepa-V and Hepa-SOCS1 cells were injected via intravenous route into NOD.scid.gamma (NSG) mice and the livers were examined macroscopically after 20 d. Representative images (left) and quantification of the liver tumor nodules (right) from four mice per group are shown; B-D: Hepa-vector and Hepa-SOCS1 were injected via intrasplenic route into NSG mice (1 × 10⁶ cells per mouse; n = 6 per group from two separate experiments) and the mice were splenectomized. After 20 d, the liver tissues were examined macroscopically for tumor nodules. The dorsal and ventral views of representative livers (B, left) and H and E-stained sections of a representative liver for each group (B, right) are shown; C: For each group, the areas of thirty random tumor nodules from three different mice were measured digitally using the NDP software and compared by Student’s paired t test; D: Western blot evaluation of STAT3 and ERK phosphorylation in the tumors from 2 mice per group; E: Western blot evaluation of MET expression and its quantification in the tumors from 3 mice per group. SOCS1: Suppressor of cytokine signaling 1.
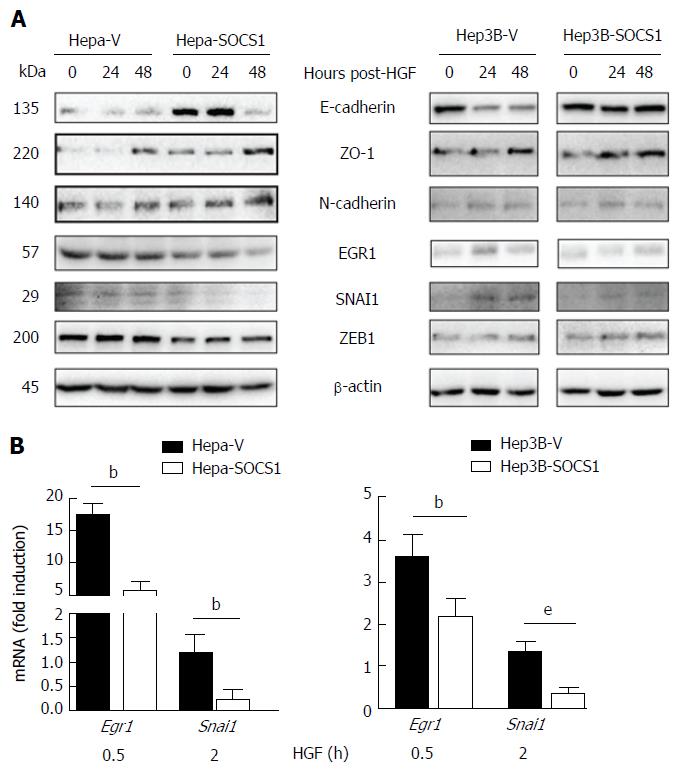
Figure 5 Effect of suppressor of cytokine signaling 1 on the expression of proteins modulated during epithelial-mesenchymal transition in hepatocyte growth factor-stimulated hepatocellular carcinoma cells.
A: Hepa-V and Hepa-SOCS1, and Hep3B-V and Hep3B-SOCS1 were cultured in low-serum medium (0.25%) overnight and stimulated or not with m-HGF or h-HGF for 24 or 48 h. Unstimulated and HGF-stimulated cells were lysed in SDS sample buffer and analyzed by western blot for the indicated proteins. Representative data from two experiments are shown; B: Cells were stimulated with HGF for 30 min or 2 h and the expression of Egr1 and Snai1 genes was evaluated by qRT-PCR. Fold-induction relative to the housekeeping gene Gapdh was evaluated from triplicates of two separate experiments (mean ± SE). bP < 0.01,eP < 0.001. SOCS1: Suppressor of cytokine signaling 1.
- Citation: Gui Y, Khan MGM, Bobbala D, Dubois C, Ramanathan S, Saucier C, Ilangumaran S. Attenuation of MET-mediated migration and invasion in hepatocellular carcinoma cells by SOCS1. World J Gastroenterol 2017; 23(36): 6639-6649
- URL: https://www.wjgnet.com/1007-9327/full/v23/i36/6639.htm
- DOI: https://dx.doi.org/10.3748/wjg.v23.i36.6639


