Copyright
©The Author(s) 2017.
World J Gastroenterol. Sep 21, 2017; 23(35): 6403-6411
Published online Sep 21, 2017. doi: 10.3748/wjg.v23.i35.6403
Published online Sep 21, 2017. doi: 10.3748/wjg.v23.i35.6403
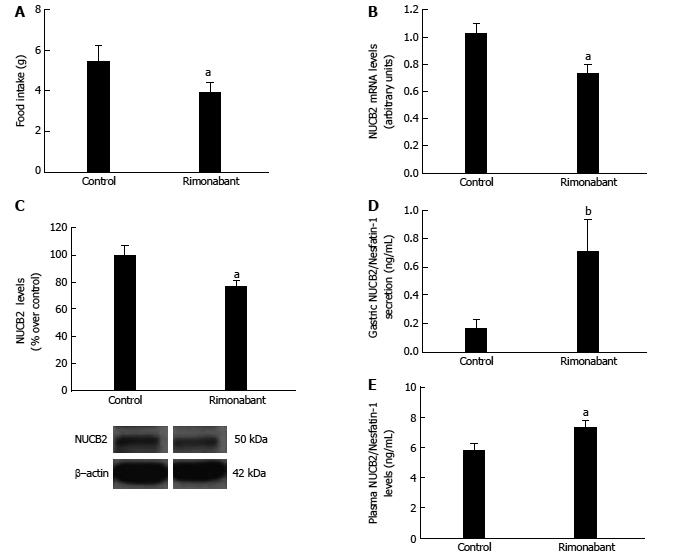
Figure 1 Effects of pharmacological blockade.
Food Intake (A), mRNA expression levels measured by real-time PCR for Nucb2 (B), Nucb2 protein levels and representative Western blot from the mucosa; β-actin was used as a loading control (C). Dividing lines indicate splicings within the same gel; D: Nucb2/Nesfatin-1 secretion from tissue explant analyzed by ELISA; E: Plasma Nucb2/Nesfatin-1 levels obtained from 36-h fasted animals that received i.p. treatment with Rimonabant (3 mg/kg i.p.) (n = 9) or vehicle (n = 9). aP < 0.05, bP < 0.01.
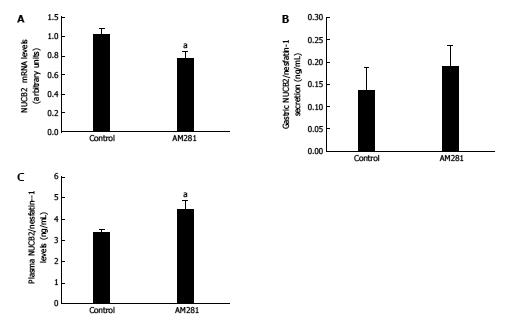
Figure 2 mRNA expression levels measured by real-time PCR for Nucb2 (A), nucb2/nesfatin-1 secretion from tissue explant analyzed by ELISA (B), plasma Nucb2/nesfatin-1 levels (C) obtained from 36-h fasted animals that received i.
p. treatment with AM281 (3 mg/Kg i.p.) (n = 6) or vehicle (n = 6). aP < 0.05 vs control.
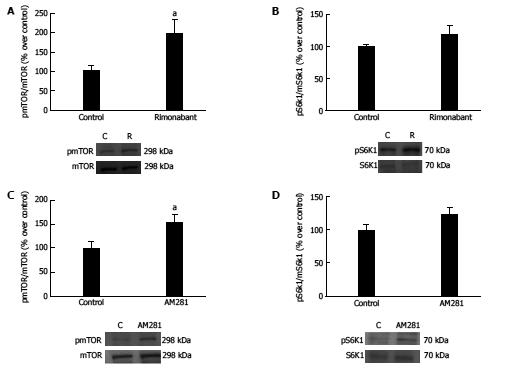
Figure 3 Measures of phospho-mTOR/mTOR levels (A) and phospho-S6K1/S6K1 (B) in gastric mucosa and representative Western blots from animals in the fasting state treated with i.
p. rimonabant or vehicle (n = 9). Measures of phospho-mTOR/mTOR levels (C) and phospho-S6K1/S6K1 (D) in gastric mucosa and representative Western blots from animals in the fasting state treated with i.p. AM281 (n = 6) or vehicle (n = 6). β-actin was used as a loading control. Dividing lines indicate splicings within the same gel. The results are expressed as percentages over control, aP < 0.05.
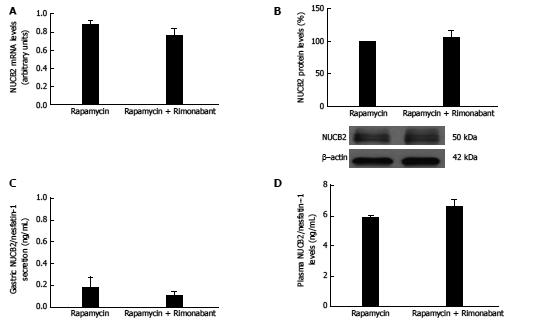
Figure 4 mRNA expression levels measured by real-time PCR for Nucb2 (A), Nucb2 protein levels and representative Western blot from the mucosa.
β-actin was used as a loading control. Dividing lines indicate splicings within the same gel (B), Nucb2/Nesfatin-1 secretion from tissue explant analyzed by ELISA (C), plasma Nucb2/Nesfatin-1 levels (D) obtained from 36-h fasted animals treated with rimonabant i.p. (n = 9) and/or rapamycin i.p. chronically for 1 wk (n = 9).
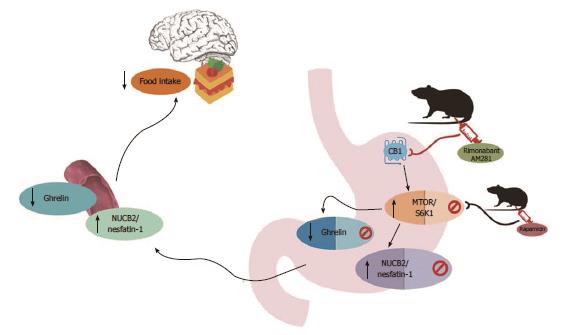
Figure 5 Graphical abstract describing the pathways of ghrelin and nucb2/nefastatin-1 and association with cannabinoid system and mTOR pathway regulating food intake.
- Citation: Folgueira C, Barja-Fernandez S, Prado L, Al-Massadi O, Castelao C, Pena-Leon V, Gonzalez-Saenz P, Baltar J, Baamonde I, Leis R, Dieguez C, Pagotto U, Casanueva FF, Tovar SA, Nogueiras R, Seoane LM. Pharmacological inhibition of cannabinoid receptor 1 stimulates gastric release of nesfatin-1 via the mTOR pathway. World J Gastroenterol 2017; 23(35): 6403-6411
- URL: https://www.wjgnet.com/1007-9327/full/v23/i35/6403.htm
- DOI: https://dx.doi.org/10.3748/wjg.v23.i35.6403


