Copyright
©The Author(s) 2017.
World J Gastroenterol. Sep 14, 2017; 23(34): 6306-6314
Published online Sep 14, 2017. doi: 10.3748/wjg.v23.i34.6306
Published online Sep 14, 2017. doi: 10.3748/wjg.v23.i34.6306
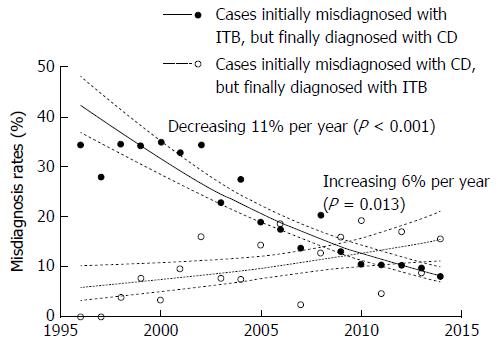
Figure 1 Temporal trends in the misdiagnosis rates between Crohn’s disease and intestinal tuberculosis during the study period.
Dots represent the observed misdiagnosis rates; lines represent the expected misdiagnosis rates and 95%CI according to the logistic regression analysis. The misdiagnosing rate of Crohn’s disease (CD) as intestinal tuberculosis (ITB) decreased to 0.89 (95%CI: 0.87-0.91) fold per year (P < 0.001); The misdiagnosing rate of ITB as CD increased to 1.06 (95%CI: 1.01-1.11) fold per year (P = 0.013).
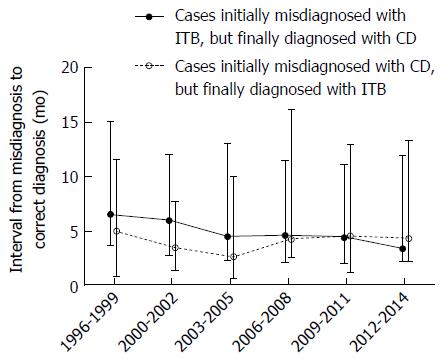
Figure 2 Temporal trends in the interval from misdiagnosis to correct diagnosis in cases of Crohn’s disease initially misdiagnosed as intestinal tuberculosis (Final Crohn’s disease group) and cases of intestinal tuberculosis initially misdiagnosed as Crohn’s disease (Final intestinal tuberculosis group).
The data are presented with the median and interquartile range. The interval from initial misdiagnosis to final diagnosis were not changed significantly in final Crohn’s disease (CD) group (P = 0.394 by Kruskal-Wallis test) and final intestinal tuberculosis (ITB) group (P = 0.748 by Kruskal-Wallis test) during the study period.
- Citation: Seo H, Lee S, So H, Kim D, Kim SO, Soh JS, Bae JH, Lee SH, Hwang SW, Park SH, Yang DH, Kim KJ, Byeon JS, Myung SJ, Yang SK, Ye BD. Temporal trends in the misdiagnosis rates between Crohn’s disease and intestinal tuberculosis. World J Gastroenterol 2017; 23(34): 6306-6314
- URL: https://www.wjgnet.com/1007-9327/full/v23/i34/6306.htm
- DOI: https://dx.doi.org/10.3748/wjg.v23.i34.6306


