Copyright
©The Author(s) 2017.
World J Gastroenterol. Sep 14, 2017; 23(34): 6242-6251
Published online Sep 14, 2017. doi: 10.3748/wjg.v23.i34.6242
Published online Sep 14, 2017. doi: 10.3748/wjg.v23.i34.6242
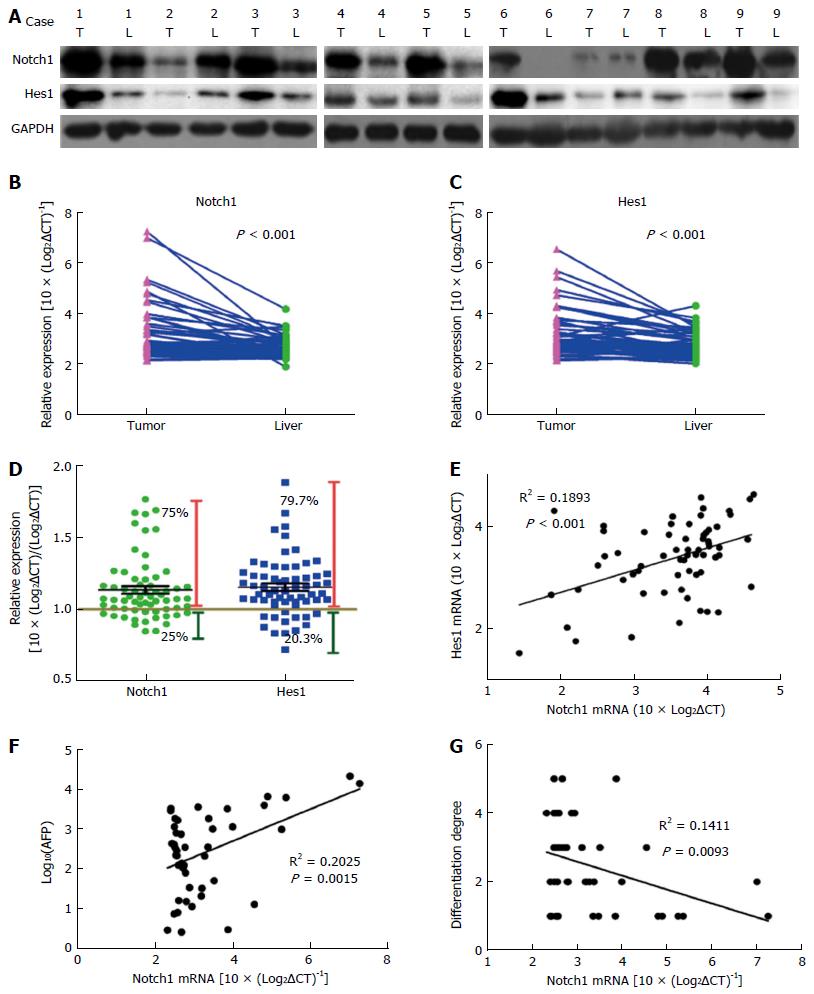
Figure 1 Notch1 expression is activated in hepatocellular carcinoma tissues and reflects differentiation properties.
Protein levels were detected by Western blot analysis. A: Notch1 and Hes1 proteins were obviously abundant in most of the tumor tissues; B and C: Gene expression levels were measured with qRT-PCR. Notch1 and Hes1 genes were expressed at higher levels in tumor tissues compared with normal liver tissues; D: Notch1 and Hes1 gene expression levels were higher in 75% and 79.7% of the hepatocellular carcinoma patients, respectively; E: A Pearson correlation analysis revealed a correlation between Notch1 and Hes1 expression (r2 = 0.1893, P < 0.001); E and G: Notch1 is positively correlated with the AFP level (r2 = 0.2025, P = 0.0015) and negatively correlated with the degree of differentiation (r2 = 0.1411, P = 0.0093).
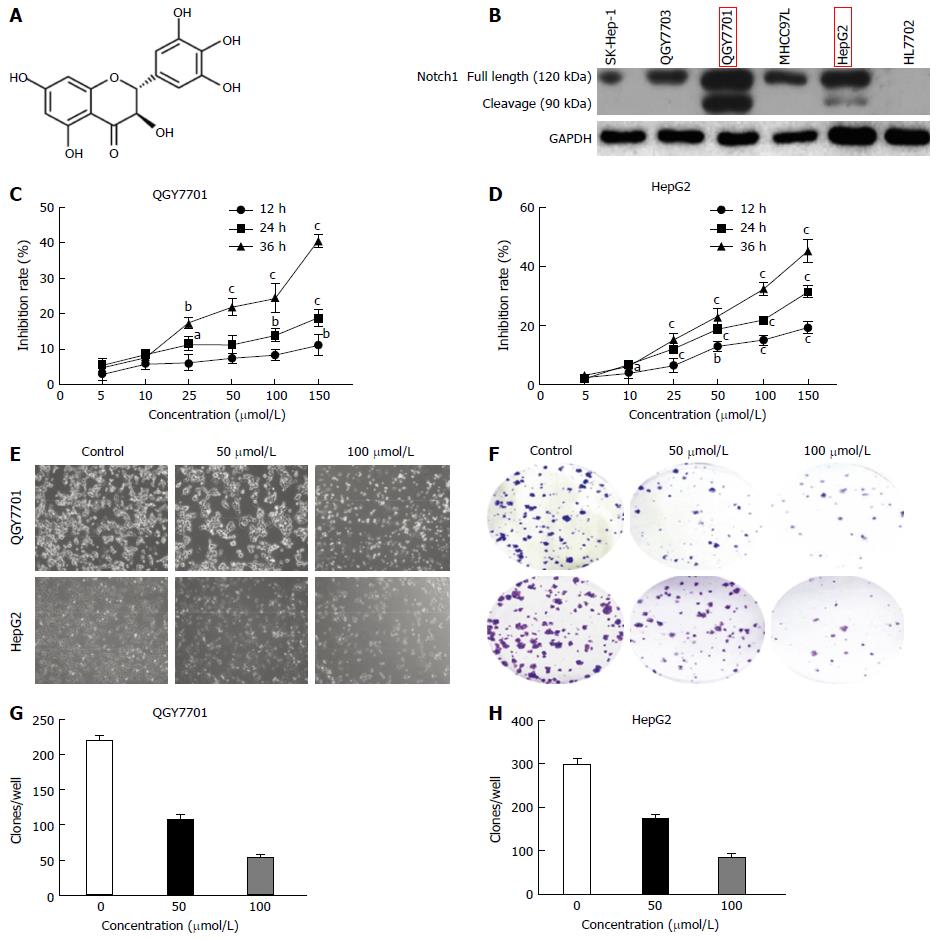
Figure 2 Dihydromyricetin inhibits the proliferation of QGY7701 and HepG2 hepatocellular carcinoma cells.
A: Chemical structure of DHM; B: The Notch1 expression profiles of several hepatocellular carcinoma (HCC) cell lines were screened by Western blotting; C and D: MTT assays were used to analyze the rate of cell inhibition (means ± SD) of QGY7701 and HepG2 cells treated with dihydromyricetin (DHM) at different concentrations (5, 10, 25, 50, 100 and 150 μmol/L) at 12 h, 24 h and 36 h; E: The proliferation of QGY7701 and HepG2 cells treated with different concentrations of DHM (0, 50, or 100 μmol/L) for 24 h was observed under microscope (× 200 magnification); F: Colony formation capability assay with different concentrations of DHM in HCC QGY7701 and HepG2 cells; G and H: The clones were quantified, and the data are presented as a statistical figure; Each experiment was repeated at least three times. aP < 0.05, bP < 0.01 and cP < 0.001, vs 0 μmol/L (control) group.
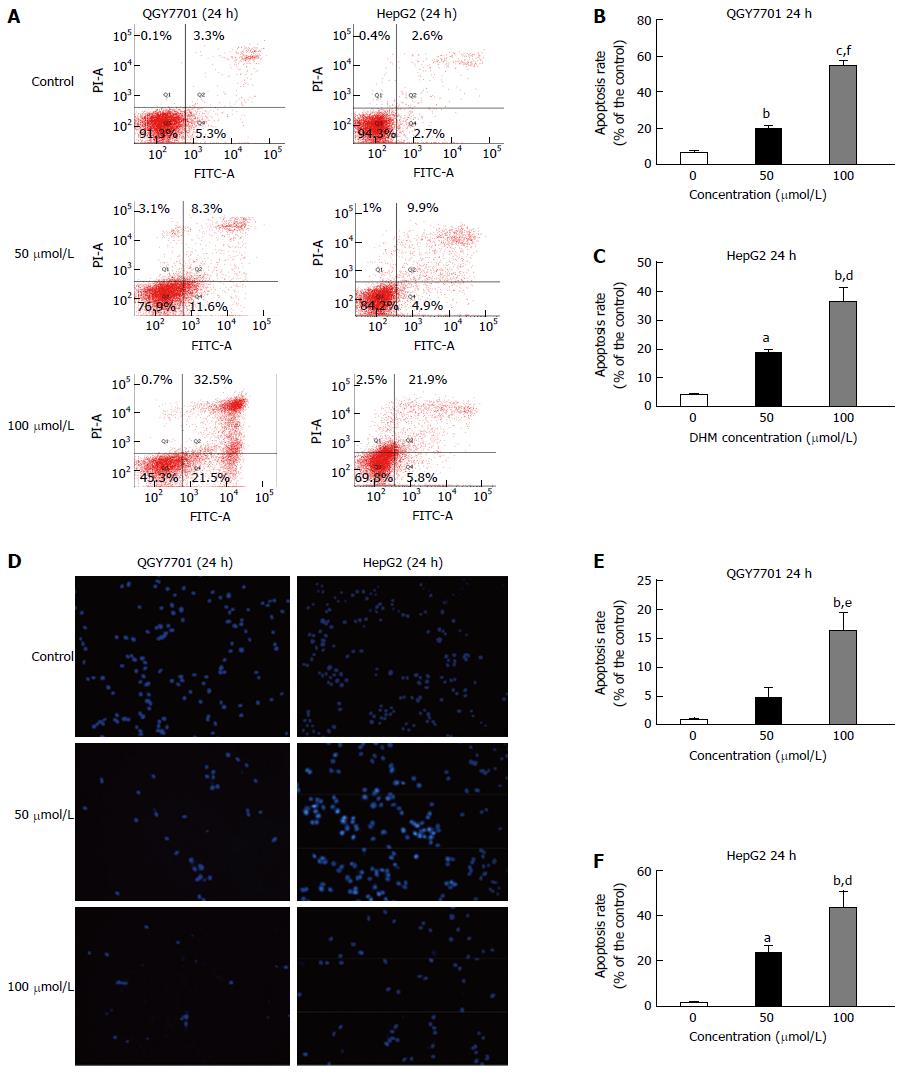
Figure 3 Dihydromyricetin induces apoptosis in QGY7701 and HepG2 hepatocellular carcinoma cells.
A: Apoptosis of QGY7701 and HepG2 cells treated with DHM at different concentrations (0, 50, or 100 μmol/L) for 24 h was analyzed by flow cytometry; B and C: Apoptosis was quantified and presented as a statistical figure; D: A TUNEL assay was utilized to examine the apoptosis of QGY7701 and HepG2 cells treated with different concentrations (0, 50, or 100 μmol/L) of DHM for 24 h; E and F: Apoptosis was quantified and presented as a statistical figure; Each experiment was repeated more than three times; aP < 0.05, bP < 0.01, cP < 0.001 vs 0 μmol/L (control) group; eP < 0.05, dP < 0.01, fP < 0.001 vs 50 μmol/L group.
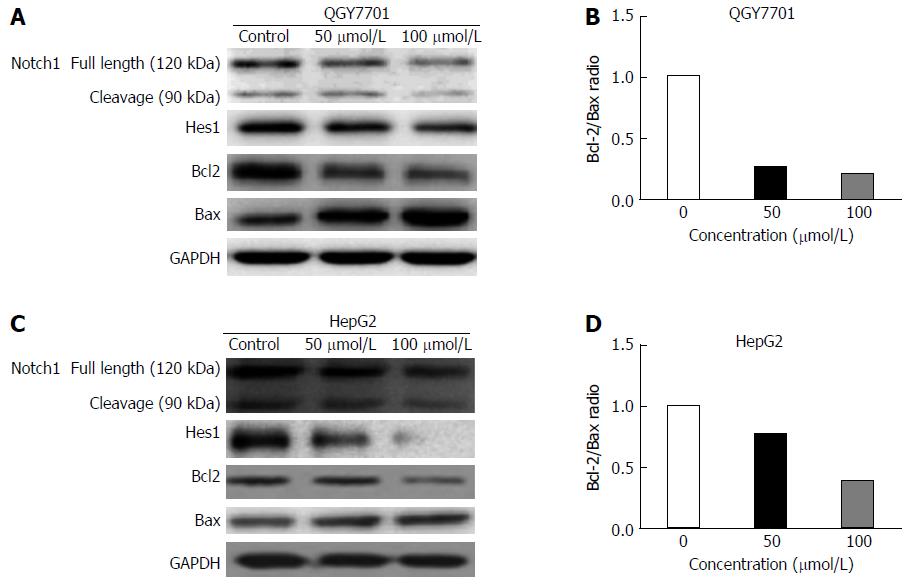
Figure 4 Effects of dihydromyricetin treatment on proteins in the Notch1 pathway and on apoptosis-related proteins in hepatocellular carcinoma cells.
A and C: The levels of the Notch1, Hes1, Bcl-2, and Bax proteins in QGY7701 and HepG2 cells treated with DHM at different concentrations (0, 50, or 100 μmol/L) were analyzed by western blot; B and D: The Bcl-2/Bax protein ratios were measured by optical density analysis with ImageJ software.
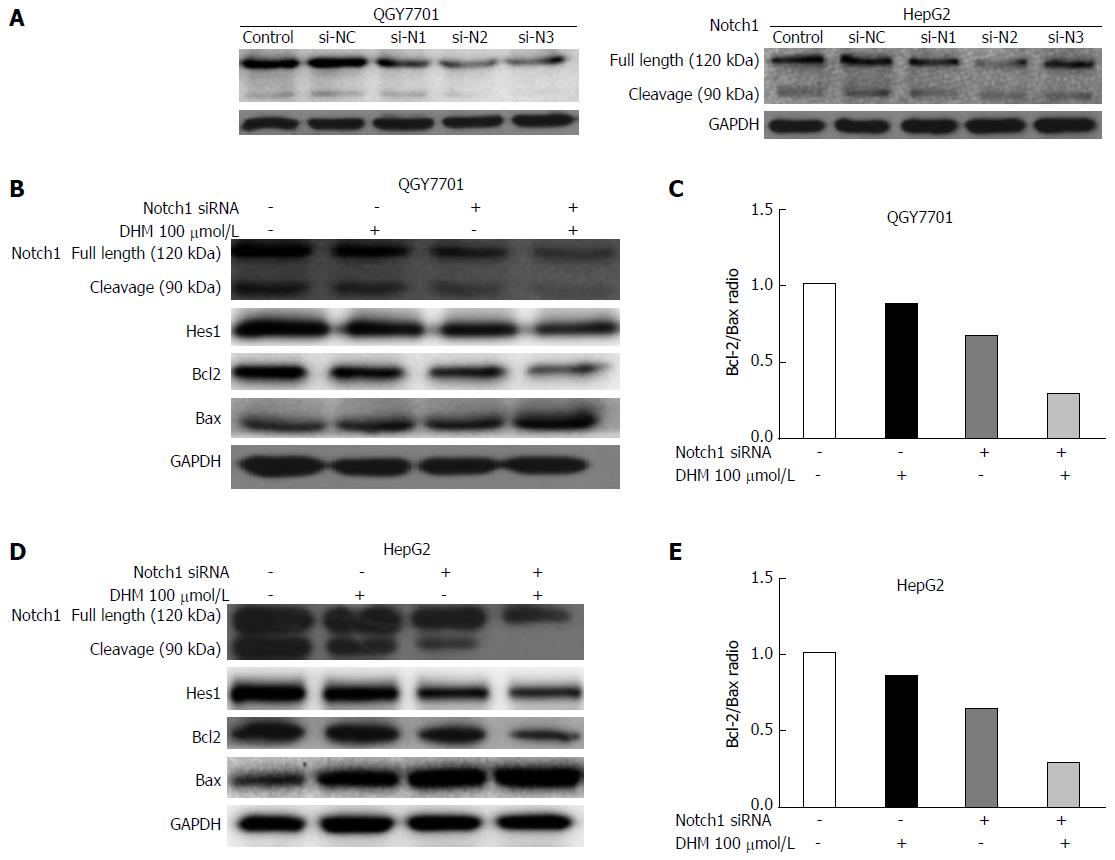
Figure 5 Dihydromyricetin induced apoptosis in hepatocarcinoma cells by downregulating the Notch1 pathway.
A: Knockdown efficiency of 3 different Notch1 siRNA sequences was tested in both QGY7701 and HepG2 cell lines by Western blot; B and D: The effects of different treatment methods (Notch1-siRNA, dihydromyricetin 100 μmol/L, and combined treatment) on Notch1, Hes1, Bcl-2, and Bax protein levels as determined by Western blot; C and E: The Bcl-2/Bax protein ratios were measured by optical density analysis with ImageJ software. si-NC: si-negative control; si-N1: si-Notch1-1; si-N2: si-Notch1-2; si-N3: si-Notch1-3.
- Citation: Lu CJ, He YF, Yuan WZ, Xiang LJ, Zhang J, Liang YR, Duan J, He YH, Li MY. Dihydromyricetin-mediated inhibition of the Notch1 pathway induces apoptosis in QGY7701 and HepG2 hepatoma cells. World J Gastroenterol 2017; 23(34): 6242-6251
- URL: https://www.wjgnet.com/1007-9327/full/v23/i34/6242.htm
- DOI: https://dx.doi.org/10.3748/wjg.v23.i34.6242


