Copyright
©The Author(s) 2017.
World J Gastroenterol. Sep 14, 2017; 23(34): 6231-6241
Published online Sep 14, 2017. doi: 10.3748/wjg.v23.i34.6231
Published online Sep 14, 2017. doi: 10.3748/wjg.v23.i34.6231
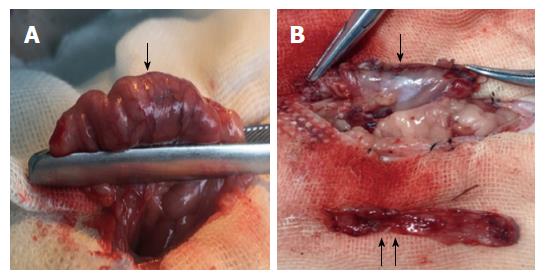
Figure 1 An intact stomach before SG (A) and the remnant stomach (↓) and resected gastric fundus (↑↑) after SG (B).
The ↓ appearing in the figure A means that the gastric fundus and a large portion of the gastric body should be resected.
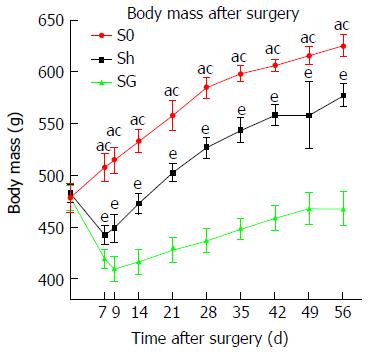
Figure 2 Body mass before and after surgery.
Statistical differences were analyzed by one-way ANOVA followed by the LSD-t test. aP < 0.05, S0 vs SG; cP < 0.05, S0 vs Sh; eP < 0.05, Sh vs SG. LSD: Least significant difference; Sh: Sham operation group; SG: Sleeve gastrectomy.
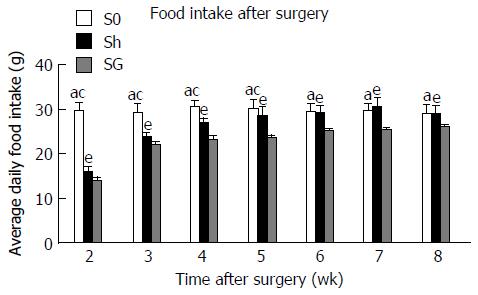
Figure 3 Food intake after surgery.
Statistical differences were analyzed by one-way ANOVA followed by the least significant difference-t test. aP < 0.05, S0 vs SG; cP < 0.05, S0 vs Sh; eP < 0.05, Sh vs SG. LSD: Least significant difference; Sh: Sham operation group; SG: Sleeve gastrectomy.
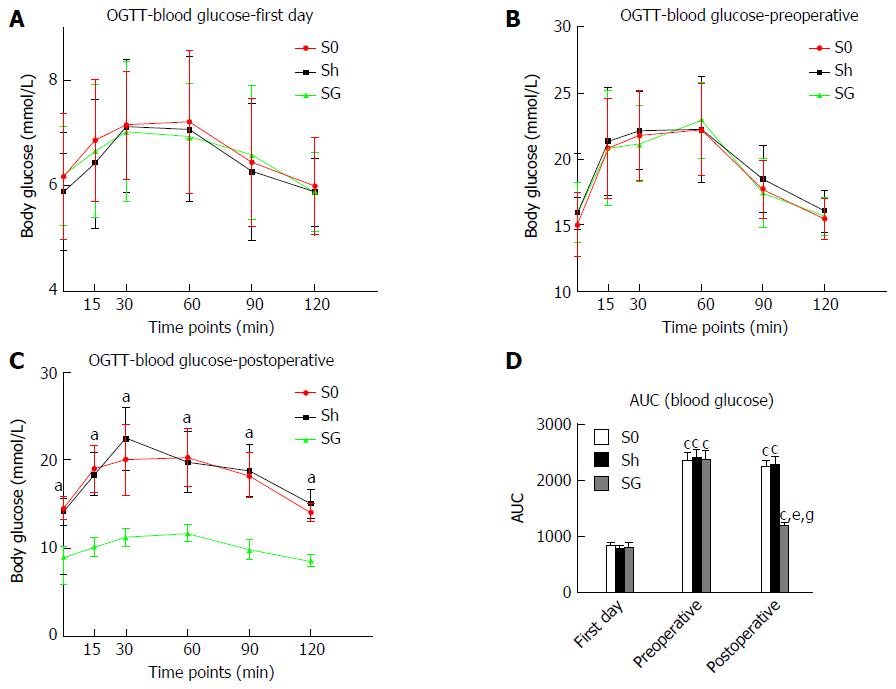
Figure 4 Oral glucose tolerance test curve of blood glucose at the first day (A), preoperatively (B) and postoperatively (C) and AUC-blood glucose (D).
Statistical differences among the three groups at the same time point were analyzed by one-way ANOVA followed by LSD-t test and between two time points in one group using paired t test. C: aP < 0.05, SG vs S0 and Sh at the same time point; cP < 0.05, preoperative or postoperative vs first day levels in the same group; eP < 0.05, postoperative vs preoperative levels in the SG group; gP < 0.05, SG vs S0 and Sh postoperatively. OGTT: Oral glucose tolerance test; Sh: Sham operation group; SG: Sleeve gastrectomy; LSD: Least significant difference.
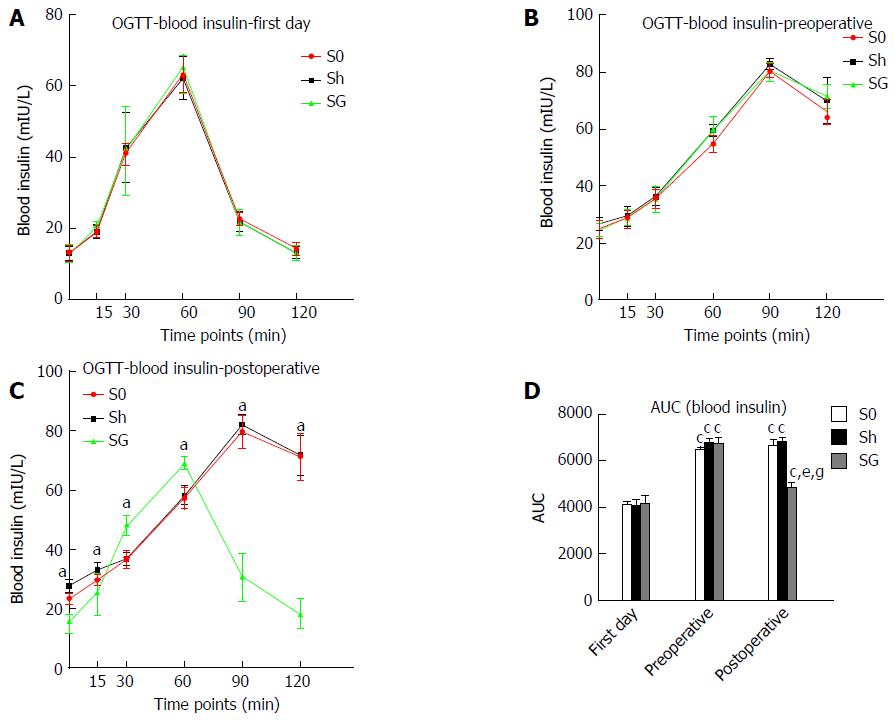
Figure 5 Oral glucose tolerance test curve of blood insulin at the first day (A), preoperatively (B) and postoperatively (C) and AUC-blood insulin (D).
Statistical differences among the three groups at the same time point were analyzed by one-way ANOVA followed by LSD-t test and between two time points in one group using paired t test. aP < 0.05, SG vs S0 and Sh at the same time point; cP < 0.05, preoperative or postoperative vs first day levels in the same group; eP < 0.05, postoperative vs preoperative levels in the SG group; gP < 0.05, SG vs S0 and Sh postoperatively. OGTT: Oral glucose tolerance test; Sh: Sham operation group; SG: Sleeve gastrectomy; LSD: Least significant difference.
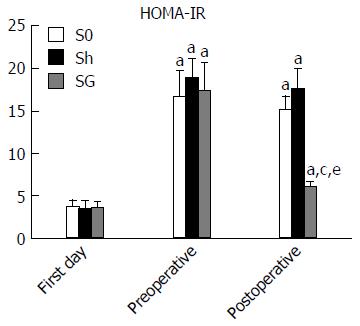
Figure 6 HOMA-IR in the S0, sham operation group and sleeve gastrectomy at the first day, preoperatively and postoperatively.
Statistical differences among the three groups at the same time point were analyzed by one-way ANOVA followed by the LSD-t test and between two time points in the same group using paired t test. aP < 0.05, preoperative or postoperative vs first day levels in the same group; cP < 0.05, postoperative vs preoperative levels in the SG group; eP < 0.05, SG vs S0 and Sh postoperatively. Sh: Sham operation group; SG: Sleeve gastrectomy.
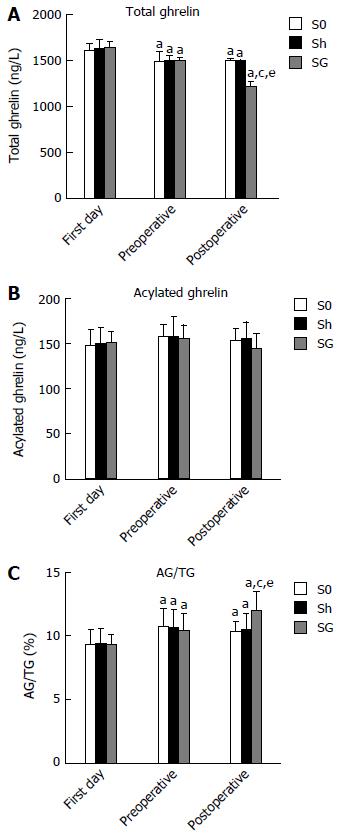
Figure 7 Changes of total ghrelin (A), acylated ghrelin (B) and acylated ghrelin/total ghrelin (C) at the first day, preoperatively and postoperatively.
Statistical differences among the three groups at the same time point were analyzed by one-way ANOVA followed by the LSD-t test and between two time points in the same group using paired t test. aP < 0.05, preoperative or postoperative vs first day levels in the same group; cP < 0.05, postoperative vs preoperative levels in the SG group; eP < 0.05, SG vs S0 and Sh postoperatively. AG: Acylated ghrelin; TG: Total ghrelin; Sh: Sham operation group; SG: Sleeve gastrectomy; LSD: Least significant difference.
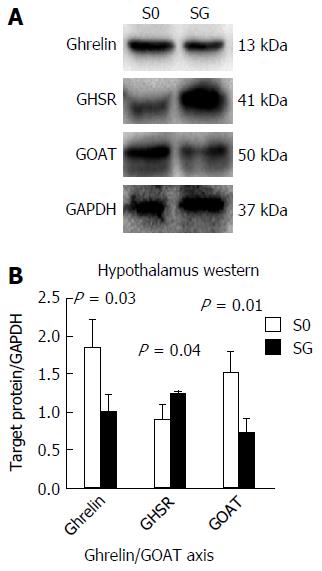
Figure 8 Ghrelin/ghrelin O-acyltransferase axis in hypothalamus.
A: Expression of ghrelin, GOAT and GHSR protein in the hypothalamus. GAPDH was used as an internal control; B: Ratio of target protein gray value to GAPDH gray value. Statistical differences between the two groups were analyzed by Student’s t test. GOAT: Ghrelin O-acyltransferase; SG: Sleeve gastrectomy.
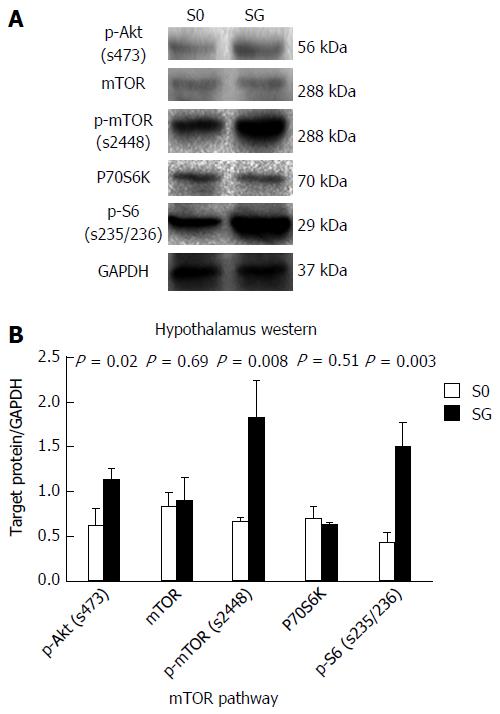
Figure 9 The mammalian target of rapamycin pathway in hypothalamus.
A: Protein expression of the mTOR pathway in the hypothalamus. GAPDH was used as an internal control; B: Ratio of target protein gray value to GAPDH gray value. Statistical differences between the two groups were analyzed by Student’s t test. SG: Sleeve gastrectomy; mTOR: Mammalian target of rapamycin.
- Citation: Wang Q, Tang W, Rao WS, Song X, Shan CX, Zhang W. Changes of Ghrelin/GOAT axis and mTOR pathway in the hypothalamus after sleeve gastrectomy in obese type-2 diabetes rats. World J Gastroenterol 2017; 23(34): 6231-6241
- URL: https://www.wjgnet.com/1007-9327/full/v23/i34/6231.htm
- DOI: https://dx.doi.org/10.3748/wjg.v23.i34.6231


