Copyright
©The Author(s) 2017.
World J Gastroenterol. Sep 7, 2017; 23(33): 6164-6171
Published online Sep 7, 2017. doi: 10.3748/wjg.v23.i33.6164
Published online Sep 7, 2017. doi: 10.3748/wjg.v23.i33.6164
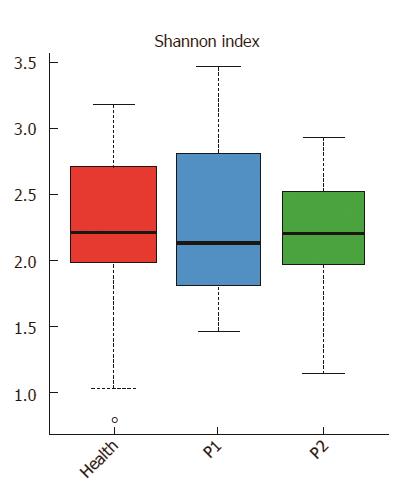
Figure 1 Gut microbial diversity of the three groups.
Distribution of Shannon index (evenness) is shown. Red, blue, and green represent the Health, P1 and P2 groups, respectively. The gut microbiota (GM) of the healthy infants was more stable than that of the other two groups.
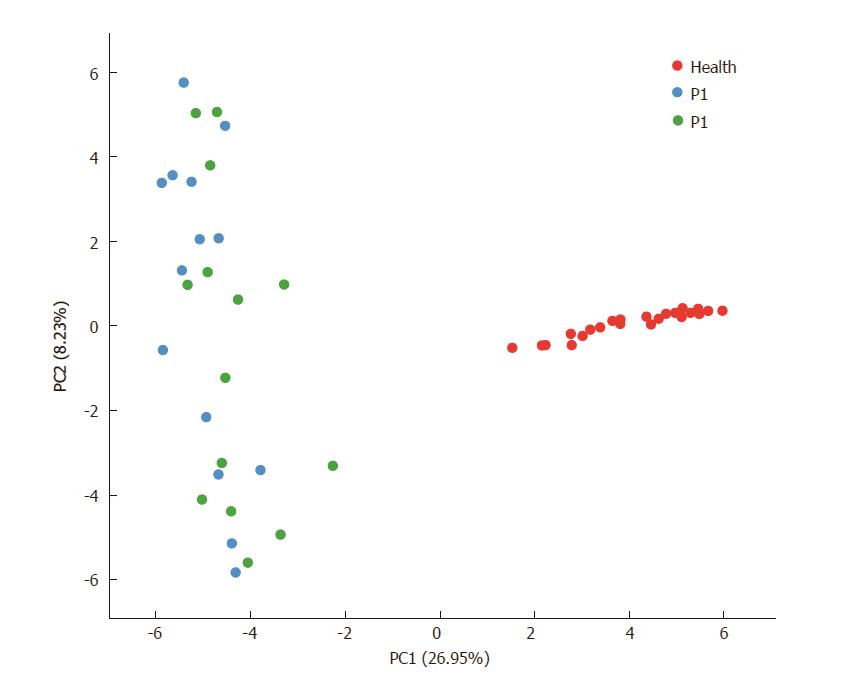
Figure 2 Principal component analysis.
Each plot in the principal component analysis (PCA) graph stands for a sample. Red, blue and green colors represent the Health, P1 and P2 groups, respectively.
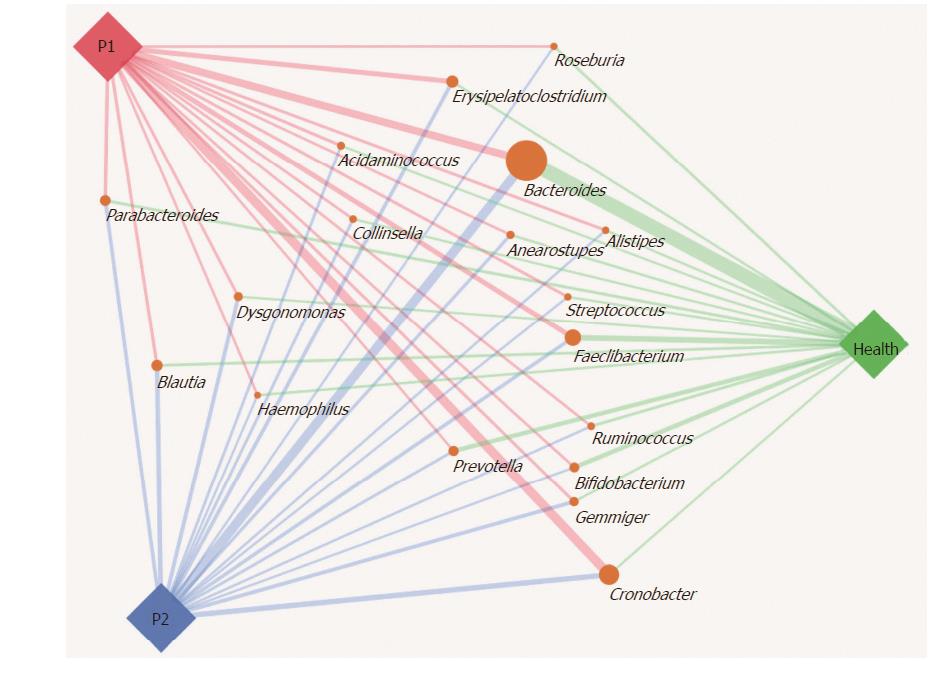
Figure 3 Gut microbiota structures in the Health, P1 and P2 groups at the genus level.
SVG package (version 1.1) was used to produce the paragraph. The size of the circle representing each genus was determined by the relative abundance of the three groups, and the width of line linking the P1, P2 and Health groups indicates the relative abundance of each group.
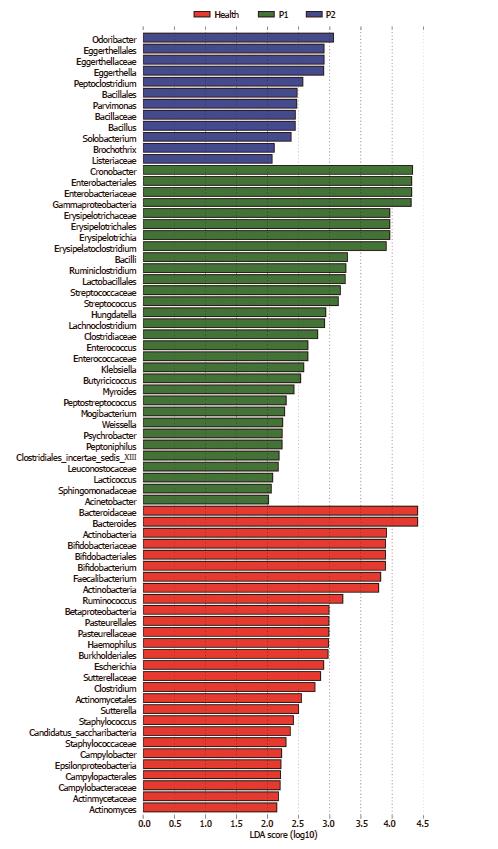
Figure 4 Significantly enriched gut microbiota components in the Health, P1 and P2 groups.
LEfSe analysis was applied to detect the gut microbiota (GM) components in the three groups. Red, green, and blue represent the Health, P1 and P2 groups, respectively. The LDA score was set as ≤ 2. The enrichment degree is proportional to the LDA score.
- Citation: Xie G, Zhou Q, Qiu CZ, Dai WK, Wang HP, Li YH, Liao JX, Lu XG, Lin SF, Ye JH, Ma ZY, Wang WJ. Ketogenic diet poses a significant effect on imbalanced gut microbiota in infants with refractory epilepsy. World J Gastroenterol 2017; 23(33): 6164-6171
- URL: https://www.wjgnet.com/1007-9327/full/v23/i33/6164.htm
- DOI: https://dx.doi.org/10.3748/wjg.v23.i33.6164


