Copyright
©The Author(s) 2017.
World J Gastroenterol. Sep 7, 2017; 23(33): 6164-6171
Published online Sep 7, 2017. doi: 10.3748/wjg.v23.i33.6164
Published online Sep 7, 2017. doi: 10.3748/wjg.v23.i33.6164
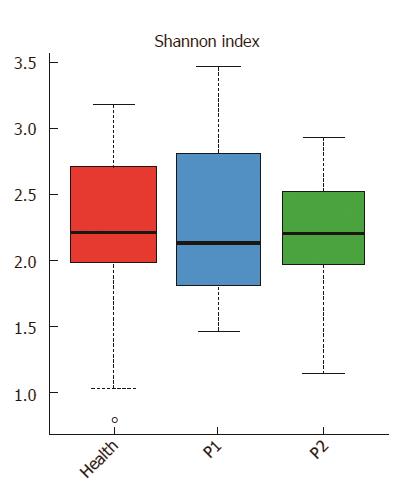
Figure 1 Gut microbial diversity of the three groups.
Distribution of Shannon index (evenness) is shown. Red, blue, and green represent the Health, P1 and P2 groups, respectively. The gut microbiota (GM) of the healthy infants was more stable than that of the other two groups.
- Citation: Xie G, Zhou Q, Qiu CZ, Dai WK, Wang HP, Li YH, Liao JX, Lu XG, Lin SF, Ye JH, Ma ZY, Wang WJ. Ketogenic diet poses a significant effect on imbalanced gut microbiota in infants with refractory epilepsy. World J Gastroenterol 2017; 23(33): 6164-6171
- URL: https://www.wjgnet.com/1007-9327/full/v23/i33/6164.htm
- DOI: https://dx.doi.org/10.3748/wjg.v23.i33.6164


