Copyright
©The Author(s) 2017.
World J Gastroenterol. Aug 21, 2017; 23(31): 5722-5731
Published online Aug 21, 2017. doi: 10.3748/wjg.v23.i31.5722
Published online Aug 21, 2017. doi: 10.3748/wjg.v23.i31.5722
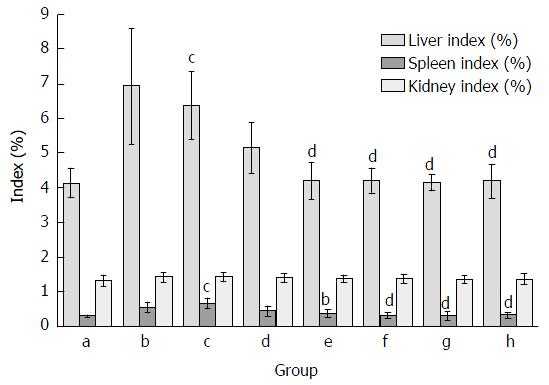
Figure 1 Effect of Foeniculum vulgare root bark extract on organ indexes in hepatic fibrosis mice.
Data are expressed as the mean ± SD (n = 20). bP < 0.01 vs the normal control group; cP < 0.05 vs the CCl4-treated group; dP < 0.01 vs the CCl4-treated group. a: Normal group; b: Solvent group + CCl4; c: CCl4-treated group; d, e, f and g: FVRB treatment groups (88, 176, 352 and 704 mg/kg, respectively); h: Yiganling Pian + CCl4.
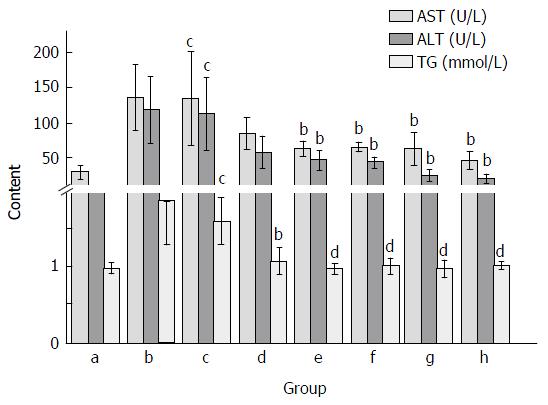
Figure 2 Effect of Foeniculum vulgare root bark extract on alanine aminotransferase, aspartate aminotransferase and triglyceride activities in CCl4-treated mice.
Data are expressed as the mean ± SD (n = 20). bP < 0.01 vs the normal control group; cP < 0.05 vs the CCl4-treated group; dP < 0.01 vs the CCl4-treated group. a: Normal group; b: Solvent group + CCl4; c: CCl4-treated group; d, e, f and g: FVRB treatment groups (88, 176, 352 and 704 mg/kg, respectively); h: Yiganling Pian + CCl4.
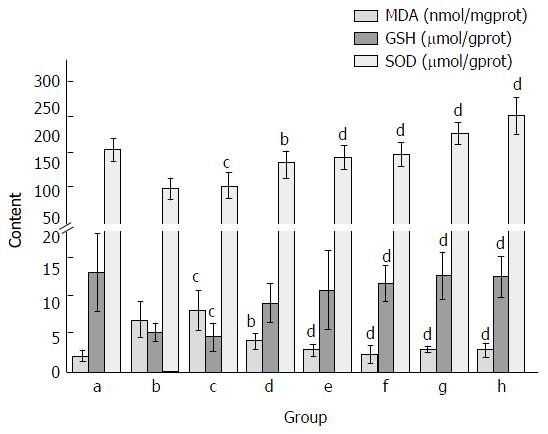
Figure 3 Effect of Foeniculum vulgare root bark extract on malondialdehyde, glutathione and superoxide dismutase levels in CCl4-treated mice.
Data are expressed as the mean ± SD (n = 20). bP < 0.01 vs the normal control group; cP < 0.05 vs the CCl4-treated group; dP < 0.01 vs the CCl4-treated group. a: Normal group; b: Solvent group + CCl4; c: CCl4-treated group; d, e, f and g: FVRB treatment groups (88, 176, 352 and 704 mg/kg, respectively); h: Yiganling Pian + CCl4.
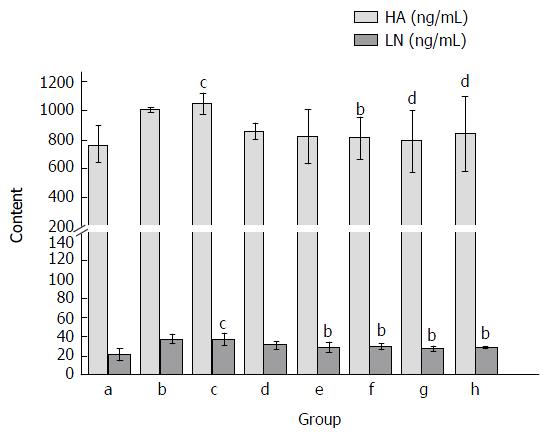
Figure 4 Effect of Foeniculum vulgare root bark extract on serum hexadecenoic acid and laminin levels in mice.
Data are expressed as the mean ± SD (n = 20). bP < 0.01 vs the normal control group; cP < 0.05 vs the CCl4-treated group; dP < 0.01 vs the CCl4-treated group. a: Normal group; b: Solvent group + CCl4; c: CCl4-treated group; d, e, f and g: Foeniculum vulgare root bark (FVRB) treatment groups (88, 176, 352 and 704 mg/kg, respectively); h: Yiganling Pian + CCl4.
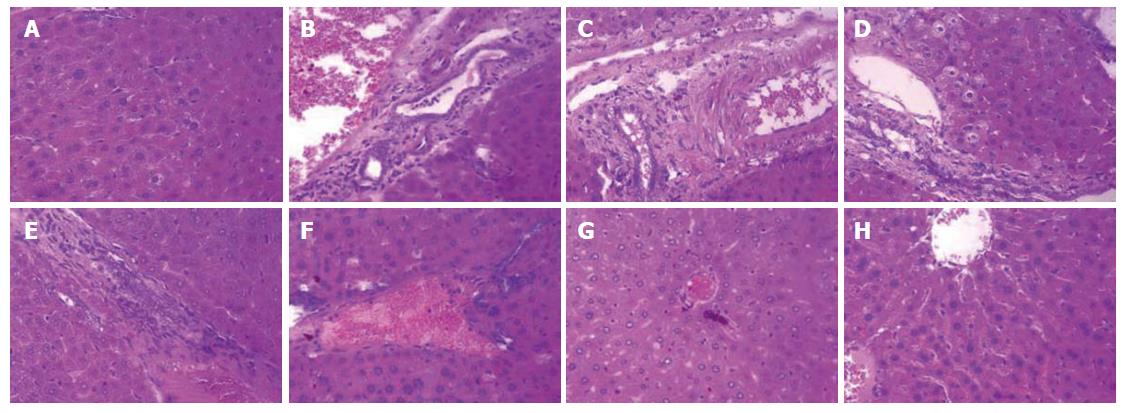
Figure 5 H and E staining (× 400) of the liver sections of mice.
A: Normal control group; B: Solvent group + CCl4; C: CCl4-treated group; D-G: Foeniculum vulgare root bark (FVRB) treatment groups (88, 176, 352 and 704 mg/kg, respectively); H: Yiganling Pian + CCl4.
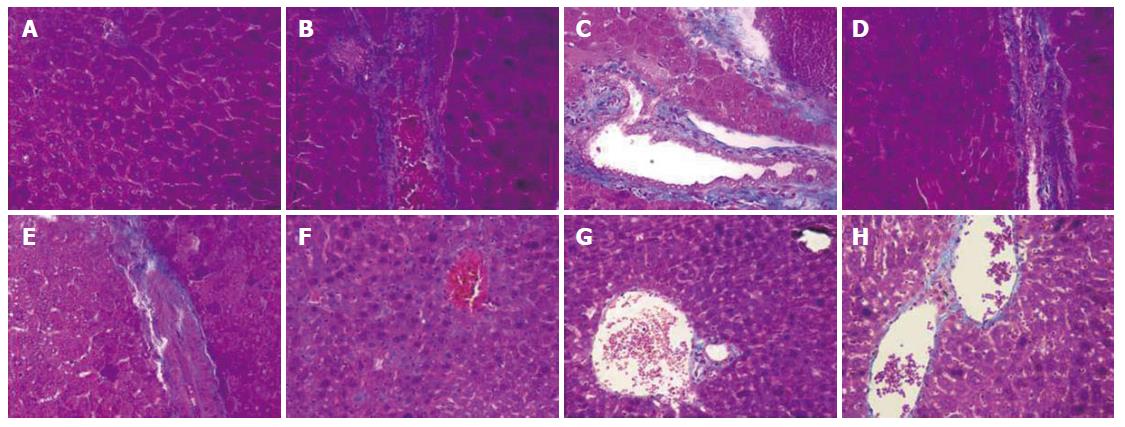
Figure 6 Masson trichrome staining (× 400) of the liver sections of mice.
A: Normal control group; B: Solvent group + CCl4; C: CCl4-treated group; D-G: FVRB treatment groups (88, 176, 352and 704 mg/kg, respectively); H: Yiganling Pian + CCl4.
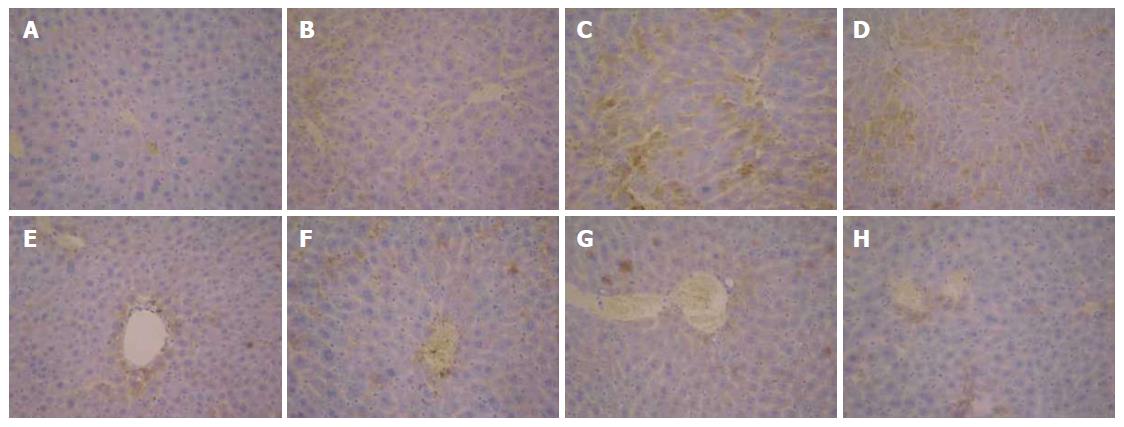
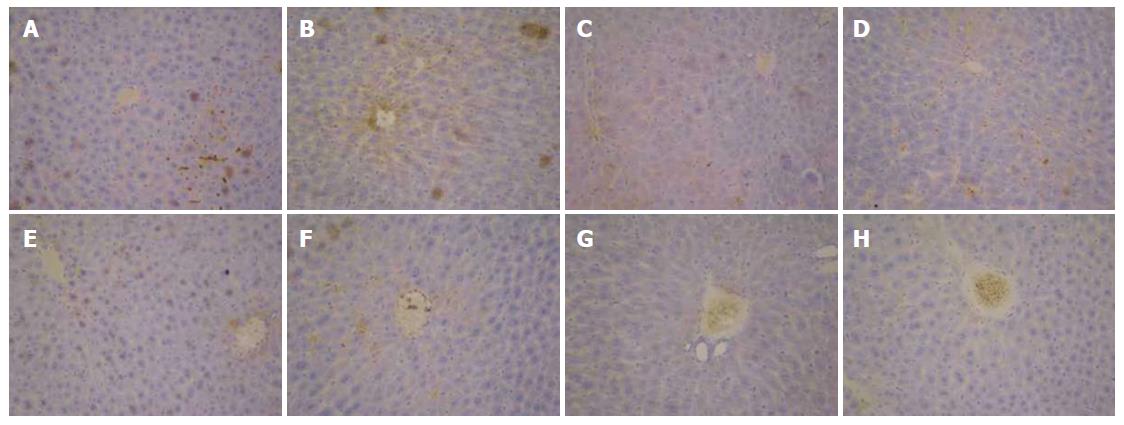
Figure 7 Immunohistochemical examination (× 400) of transforming growth factor β1 expression in liver tissues of mice.
A: Normal group; B: Solvent group + CCl4; c: CCl4-treated group; D-G: Foeniculum vulgare root barks (FVRB) treatment groups (88, 176, 352 and 704 mg/kg, respectively); H: Yiganling Pian + CCl4.
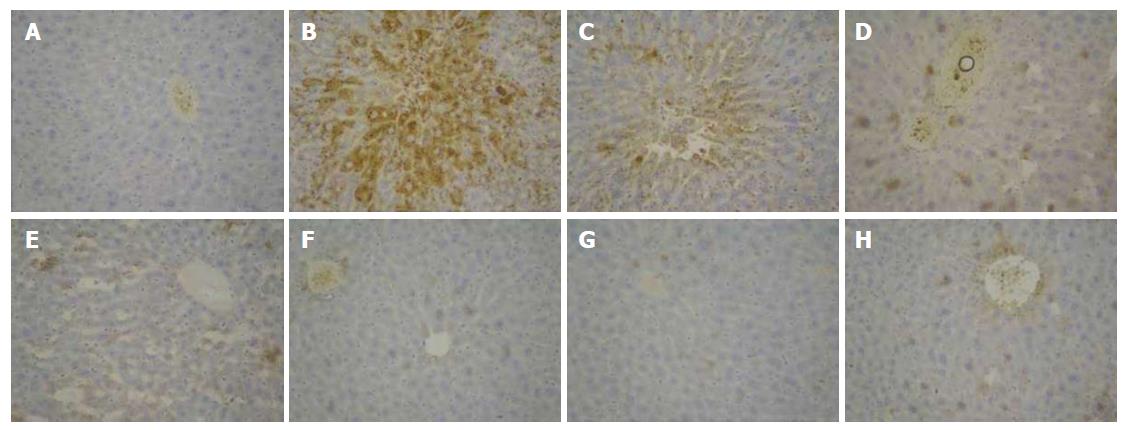
Figure 8 Immunohistochemical examination (× 400) of matrix metalloprotein 9 expression in liver tissues of mice.
A: Normal control group; B: Solvent group + CCl4; C: CCl4-treated group; D-G: Foeniculum vulgare root bark (FVRB) treatment groups (88, 176, 352 and 704 mg/kg, respectively); H: Yiganling Pian + CCl4.
Figure 9 Immunohistochemical examination (× 400) of metallopeptidase inhibitor 1 expression in liver tissues of mice.
A: Normal control group; B: Solvent group + CCl4; C: CCl4-treated group; D-G: Foeniculum vulgare root bark (FVRB) treatment groups (88, 176, 352 and 704 mg/kg, respectively); H: Yiganling Pian + CCl4.
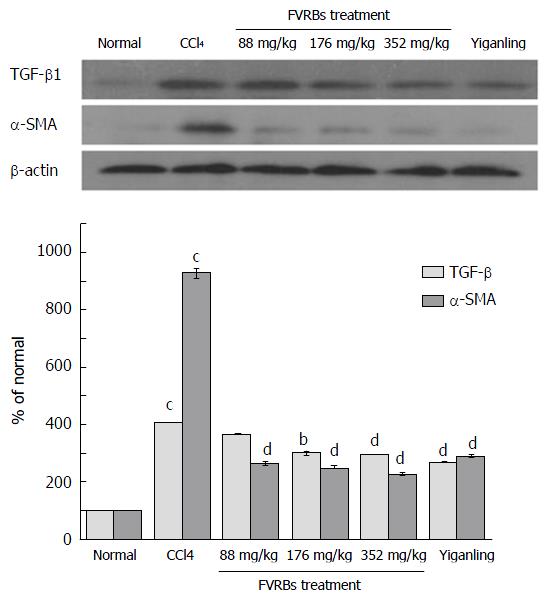
Figure 10 Effect of Foeniculum vulgare root bark extract on the expression of transforming growth factor-β1 and α-SMA proteins.
bP < 0.01 vs the normal control group; cP < 0.05 vs the CCl4-treated group; dP < 0.01 vs the CCl4-treated group. TGF-β: Transforming growth factor β; α-SMA: Alpha-smooth muscle actin.
- Citation: Zhang C, Tian X, Zhang K, Li GY, Wang HY, Wang JH. Protective effects of Foeniculum vulgare root bark extract against carbon tetrachloride-induced hepatic fibrosis in mice. World J Gastroenterol 2017; 23(31): 5722-5731
- URL: https://www.wjgnet.com/1007-9327/full/v23/i31/5722.htm
- DOI: https://dx.doi.org/10.3748/wjg.v23.i31.5722


