Copyright
©The Author(s) 2017.
World J Gastroenterol. Aug 14, 2017; 23(30): 5538-5548
Published online Aug 14, 2017. doi: 10.3748/wjg.v23.i30.5538
Published online Aug 14, 2017. doi: 10.3748/wjg.v23.i30.5538
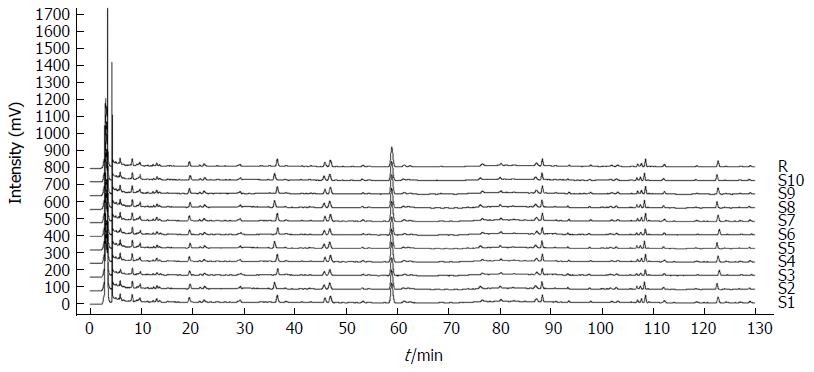
Figure 1 Yangzheng Sanjie decoction high-performance liquid chromatography fingerprints.
High-performance liquid chromatography (HPLC) analysis was performed to determine the chromatographic fingerprints of Yangzheng Sanjie decoction. Analysed with a Computer-Aided Similarity Evaluation System, the similarity scores of the HPLC fingerprints of 10 batches of samples were above 0.95.
Figure 2 Yangzheng Sanjie decoction inhibits gastric cancer cell proliferation in a time-dependent manner.
The viability of AGS (A) and HS-746T cells (B) after treatment with YCS was measured using a CCK-8 assay. aP < 0.05 vs the control group; bP < 0.01 vs the control group. YCS: YZSJD-containing serum; YZSJD: Yangzheng Sanjie decoction; CCK-8: Cell Counting Kit-8.
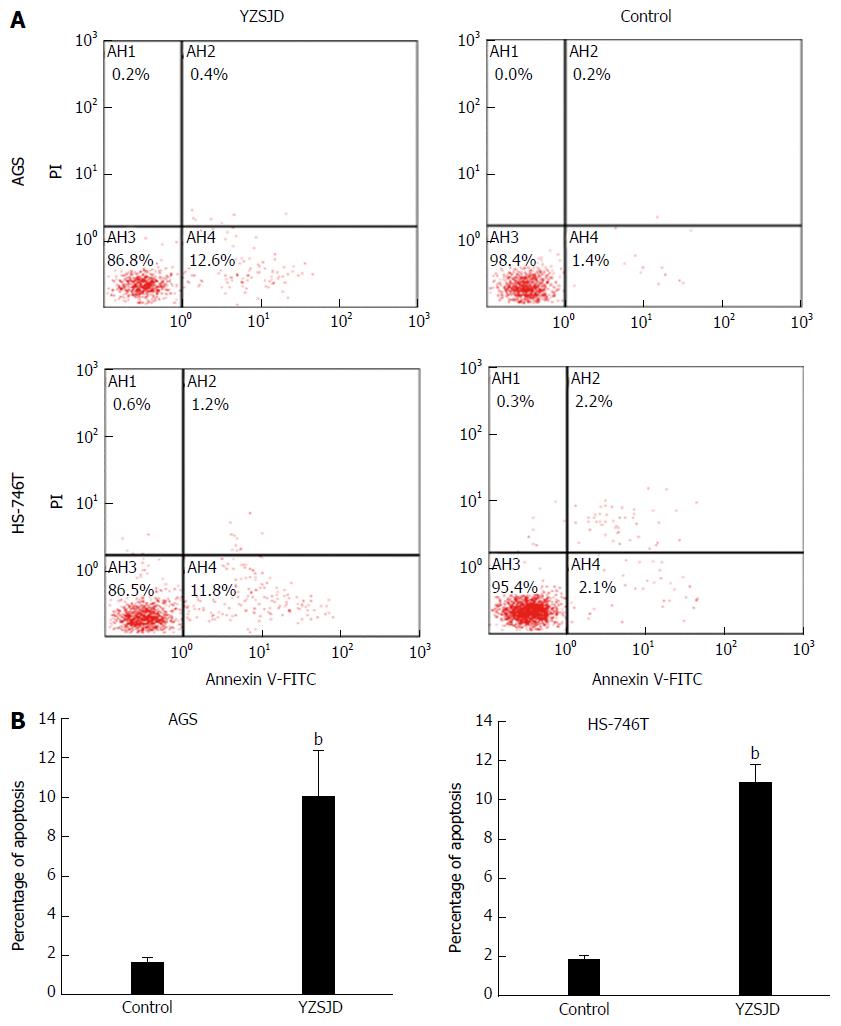
Figure 3 Effects of Yangzheng Sanjie decoction on apoptosis of gastric cancer cells.
A: After 48 h treatment with 10% YCS (left) or 10% normal rat serum (right), the apoptotic cells were determined by flow cytometry. Early apoptotic cells are shown in the lower right-hand quadrant. Representative dot plots of cell apoptosis are shown. Upper: AGS; Lower: HS-746T; B: Statistical analysis of FCM data. bP < 0.01 vs the control group. YCS: YZSJD-containing serum; YZSJD: Yangzheng Sanjie decoction.
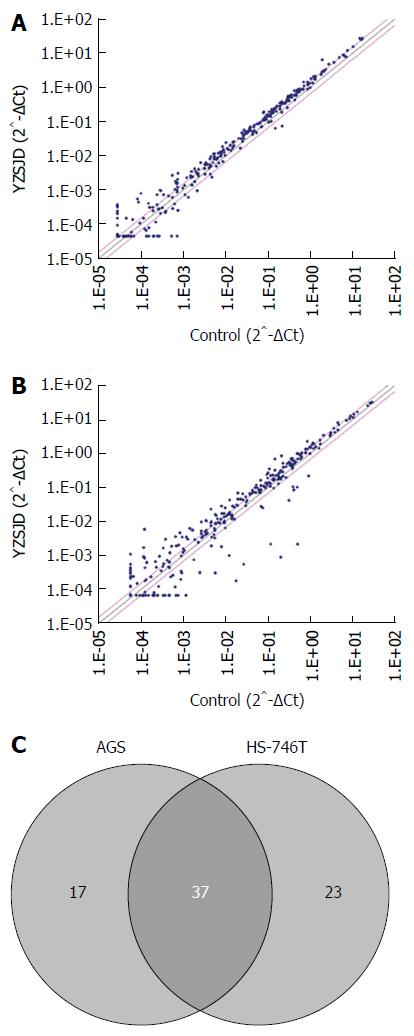
Figure 4 Effects of Yangzheng Sanjie decoction on miRNA profiles in gastric cancer cells.
Scatter plot analysis of miRNA PCR array data from AGS (A) and HS-746T (B) cells treated with 10% Yangzheng Sanjie decoction-containing serum. The pink lines indicate 1.5-fold changes. C: Venn diagram analysis of differentially expressed miRNAs unique to each cell line or shared between AGS and HS-746T cells.
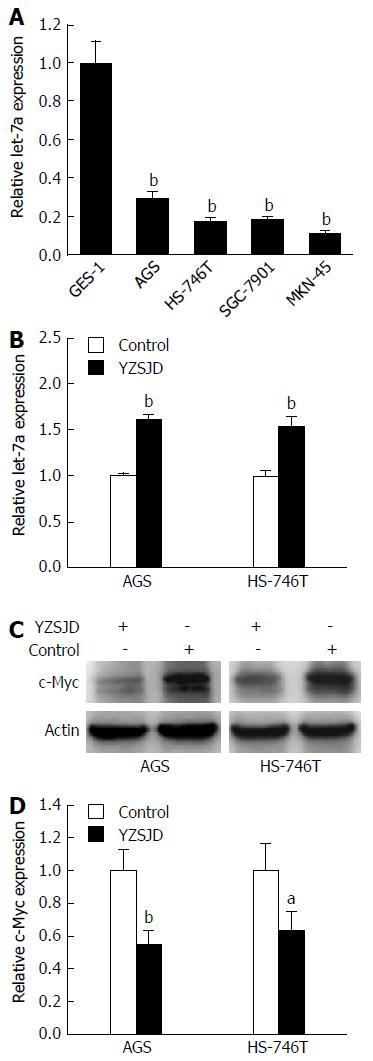
Figure 5 Effects of Yangzheng Sanjie decoction on let-7a and c-Myc expression in gastric cancer cells.
A: Down-regulation of let-7a expression in GC cells; B and C: AGS and HS-746T GC cells were treated with 10% YCS or 10% normal rat serum for 48 h, and quantitative RT-PCR was performed to determine the expression levels of let-7a (B), while c-Myc expression was measured by Wester blot (C); D: Statistical analysis of Western blot data. aP < 0.05 vs the control group; bP < 0.01 vs the control group. YCS: YZSJD-containing serum; YZSJD: Yangzheng Sanjie decoction.
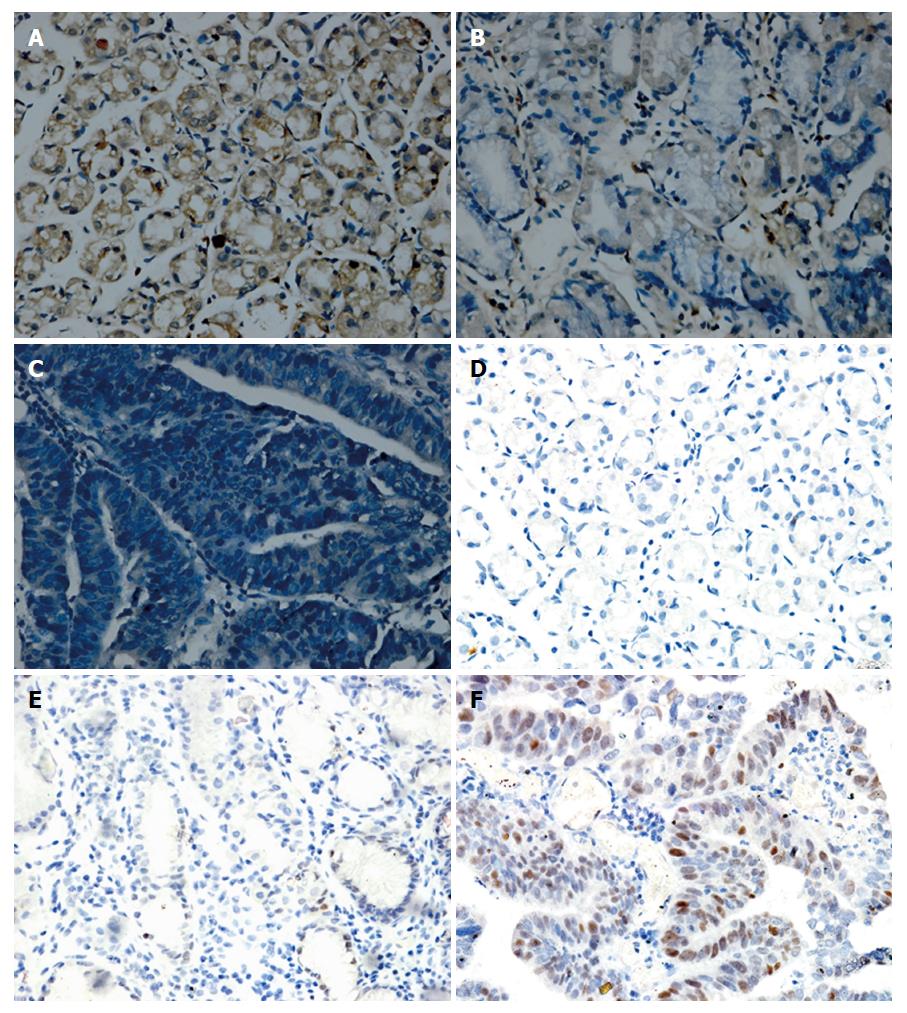
Figure 6 Expression levels of let-7a and c-Myc in gastric cancer tissues.
A-C: Expression of let-7a miRNA (ISH, × 400): high in distal normal gastric tissues (A), moderate in matched para-carcinoma tissues (B) and low in GC tissues (C). D-F: Expression of c-Myc protein (IHC, × 400): low in distal normal tissues (D), moderate in adjacent tissues (E) and high in GC tissues (F). GC: Gastric cancer; ISH: In situ hybridization; IHC: Immunohistochemistry.
- Citation: Deng HX, Yu YY, Zhou AQ, Zhu JL, Luo LN, Chen WQ, Hu L, Chen GX. Yangzheng Sanjie decoction regulates proliferation and apoptosis of gastric cancer cells by enhancing let-7a expression. World J Gastroenterol 2017; 23(30): 5538-5548
- URL: https://www.wjgnet.com/1007-9327/full/v23/i30/5538.htm
- DOI: https://dx.doi.org/10.3748/wjg.v23.i30.5538


