Copyright
©The Author(s) 2017.
World J Gastroenterol. Jul 7, 2017; 23(25): 4548-4558
Published online Jul 7, 2017. doi: 10.3748/wjg.v23.i25.4548
Published online Jul 7, 2017. doi: 10.3748/wjg.v23.i25.4548
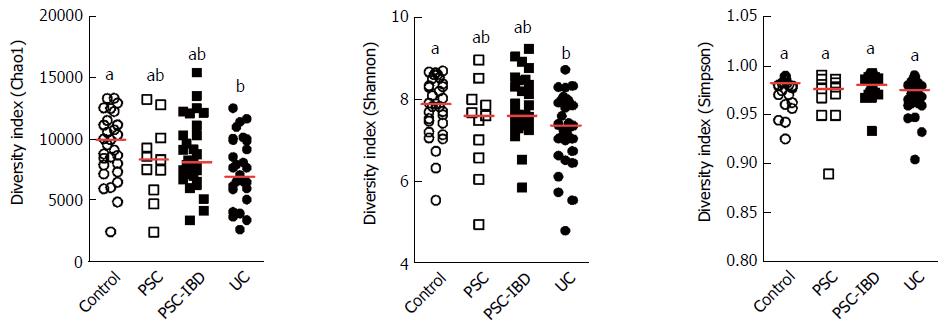
Figure 1 Alpha diversity was consistently reduced in patients with ulcerative colitis as determined by Chao1 index, Shannon index and Simpson index.
Groups labeled by the same letter (a, b) on the graph are not significantly different from each other (P < 0.05) as analyzed by ANOVA with Tuhey's post-hoc test.
Figure 2 Ordination plots shows a distinct clustering pattern of sampled bacterial communities, explained either by the liver damage (primary sclerosing cholangitis vs Healthy controls) (A) and by the intestinal inflammation (primary sclerosing cholangitis-inflammatory bowel disease vs ulcerative colitis) (B).
Both graphs are based on unweighted Unifrac distance matrix and constructed by PERMANOVA. PSC: Primary sclerosing cholangitis; UC: Ulcerative colitis; IBD: Inflammatory bowel disease.
Figure 3 Median relative abundances of microbiota at order - level in all study subjects (A) and averaged for each study groups (B).
We identified (mean ± SD) 40.83% ± 10.00% of sequences on the species level and 84.18% ± 6.83% of sequences on the genus level. PSC: Primary sclerosing cholangitis; UC: Ulcerative colitis; IBD: Inflammatory bowel disease.
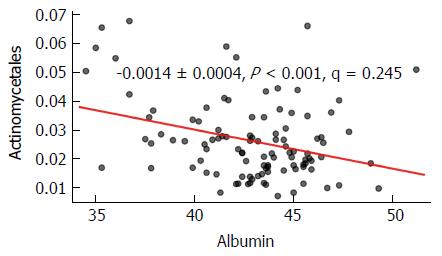
Figure 4 Abundance of order Actinomycetales negatively correlates with serum albumin levels in the total study population.
- Citation: Bajer L, Kverka M, Kostovcik M, Macinga P, Dvorak J, Stehlikova Z, Brezina J, Wohl P, Spicak J, Drastich P. Distinct gut microbiota profiles in patients with primary sclerosing cholangitis and ulcerative colitis. World J Gastroenterol 2017; 23(25): 4548-4558
- URL: https://www.wjgnet.com/1007-9327/full/v23/i25/4548.htm
- DOI: https://dx.doi.org/10.3748/wjg.v23.i25.4548


