Copyright
©The Author(s) 2017.
World J Gastroenterol. Jun 28, 2017; 23(24): 4354-4368
Published online Jun 28, 2017. doi: 10.3748/wjg.v23.i24.4354
Published online Jun 28, 2017. doi: 10.3748/wjg.v23.i24.4354
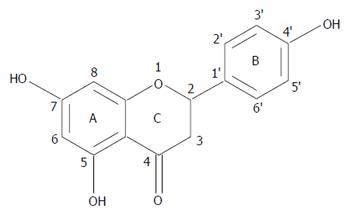
Figure 1 Chemical structure of naringenin.
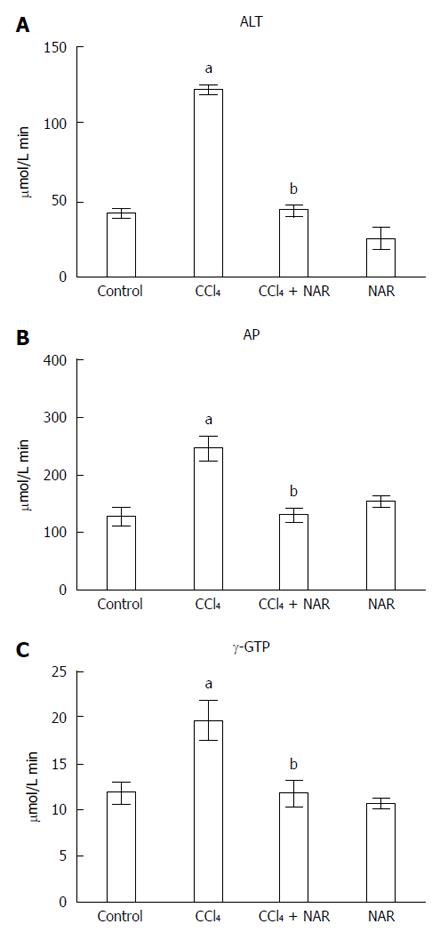
Figure 2 Naringenin prevents necrosis and cholestasis in CCl4-treated rats.
Alanine aminotransferase (ALT) (A); alkaline phosphatase (AP) (B) and γ-glutamyl transpeptidase (γ-GTP) (C) activities were determined in serum from control rats, carbon tetrachloride (CCl4)-treated rats, CCl4 plus naringenin rats (CCl4 + NAR), and rats administered with NAR alone (NAR). Values represent the mean of experiments performed in duplicate assay ± SE (n = 8). aP < 0.05 vs control group; bP < 0.05 vs CCl4 group.
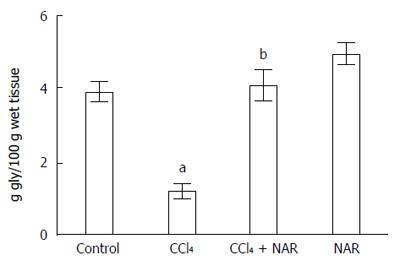
Figure 3 Naringenin prevents glycogen depletion in CCl4-treated rats.
Liver glycogen content determined in control rats, carbon tetrachloride (CCl4)-treated rats, CCl4 plus naringenin rats (CCl4 + NAR), and rats administered with NAR alone (NAR). Each bar represents the mean value of experiments performed in duplicate assay ± SE (n = 8). aP < 0.05 vs control group; bP < 0.05 vs CCl4 group.
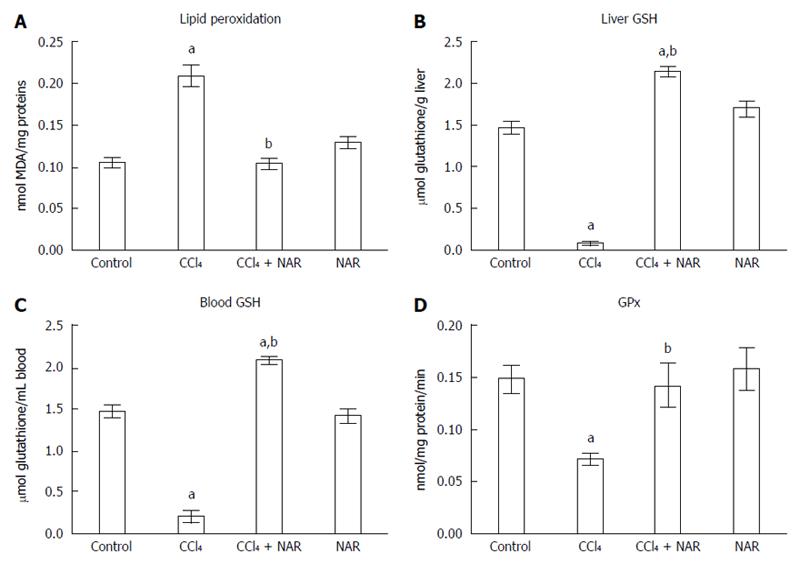
Figure 4 Naringenin prevents oxidative stress in CCl4-treated rats.
Lipid peroxidation (A), reduced glutathione (GSH) determinations in liver (B) and blood (C) and GPx activity (D) from control rats, carbon tetrachloride (CCl4)-treated rats, CCl4 plus naringenin rats (CCl4 + NAR), and rats administered with NAR alone (NAR). Each bar represents the mean value of experiments performed in duplicate assay ± SE (n = 8). aP < 0.05 vs control group; bP < 0.05 vs CCl4 group.
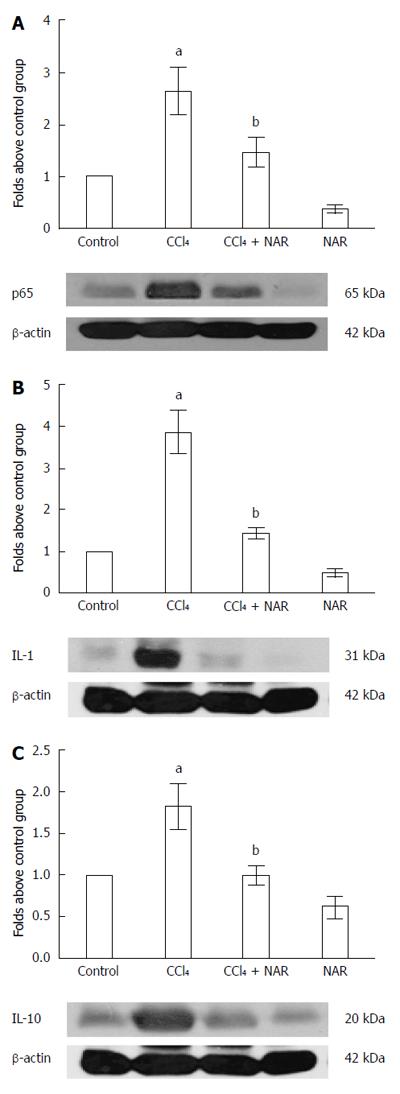
Figure 5 Naringenin prevents inflammation in CCl4-treated rats.
The NF-κB (A), IL-1 (B) and IL-10 (C) protein levels in samples of liver tissue were determined by western blot analysis from control rats, carbon tetrachloride (CCl4)-treated rats, CCl4 plus naringenin rats (CCl4 + NAR), and rats administered with NAR alone (NAR). β-actin was used as a control. Values are expressed as fold increase of relative IOD normalized to the control group values (control = 1). Each bar represents the mean value of three rats ± SE. aP < 0.05 vs control group; bP < 0.05 vs CCl4 group.
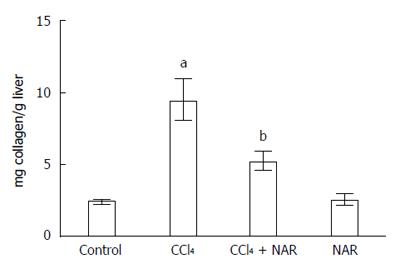
Figure 6 Naringenin prevents collagen deposition in CCl4-treated rats.
Liver collagen content determined in control rats, carbon tetrachloride (CCl4)-treated rats, CCl4 plus naringenin rats (CCl4 + NAR), and rats administered with NAR alone (NAR). Each bar represents the mean value of experiments performed in duplicate assay ± SE (n = 8). aP < 0.05 vs control group; bP < 0.05 vs CCl4 group.
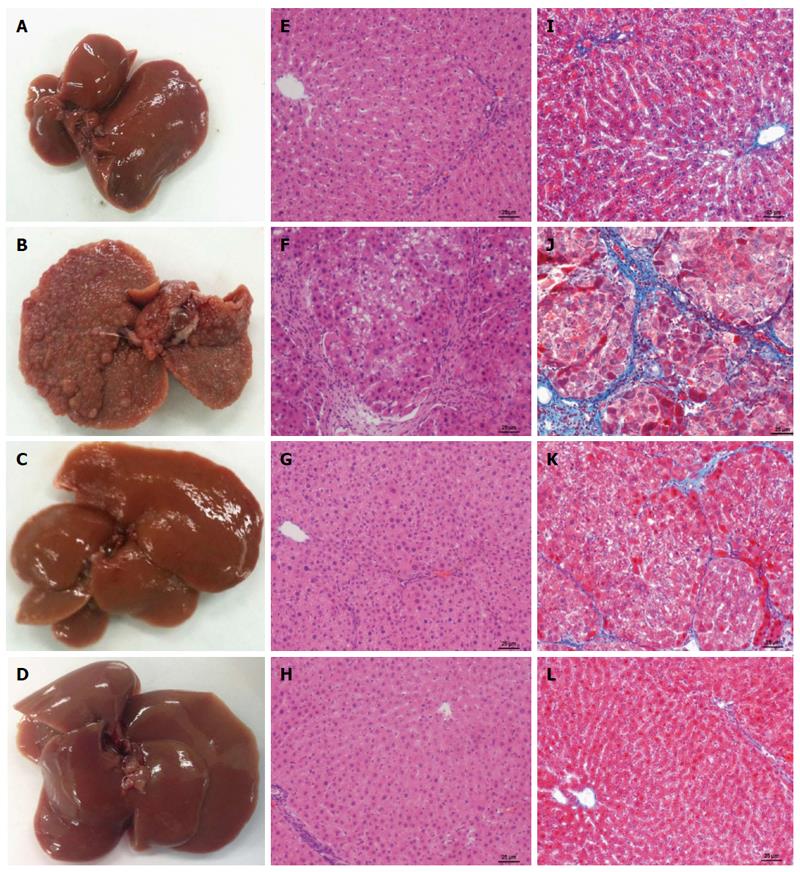
Figure 7 Naringenin effect on macroscopic and microscopic hepatic architecture in CCl4-treated rats.
Macroscopic aspect of livers in control rats (A), carbon tetrachloride (CCl4)-treated rats (B), CCl4 plus naringenin rats (CCl4 + NAR) (C), and NAR alone rats (D). Hematoxylin and Eosin stain in livers of control rats (E), CCl4-treated rats (F), CCl4 + NAR rats (G), and rats administered with NAR alone (H). Masson’s trichromic staining in livers of control rats (I), CCl4-treated rats (J), CCl4 + NAR (K), and NAR alone rats (L). Bar scale = 50 μm. Magnification × 100.
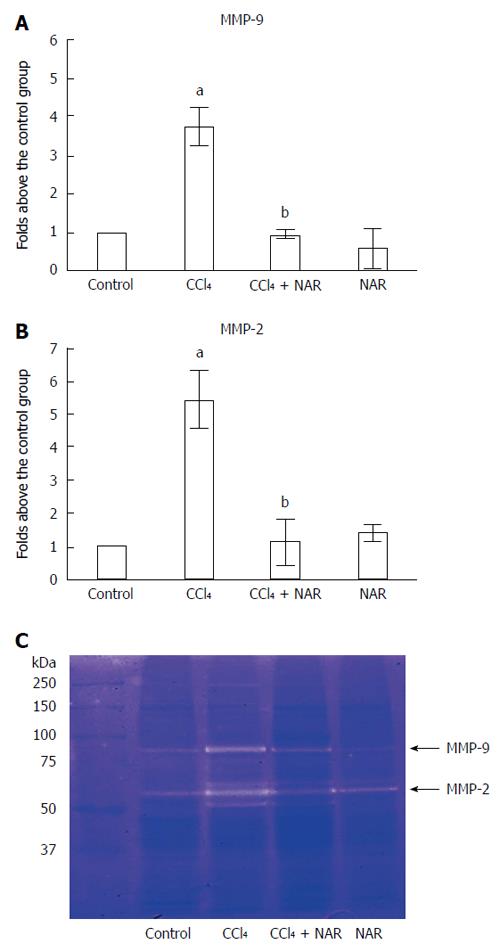
Figure 8 Naringenin prevents elevation of metalloproteinase-9 and 2 activities in CCl4-treated rats.
Matrix metalloproteinase (MMP)-9 (A) and MMP-2 (B) activities was analyzed by zymography using gelatin-substrate gels (C). Liver samples for control rats, carbon tetrachloride (CCl4)-treated rats, CCl4 plus naringenin rats (CCl4 + NAR), and rats administered with NAR alone (NAR) were analyzed. Values are expressed as average of relative IOD, normalized to the control group values (control = 1). Each bar represents the mean value of three rats ± SE. aP < 0.05 vs control group; bP < 0.05 vs CCl4 group.
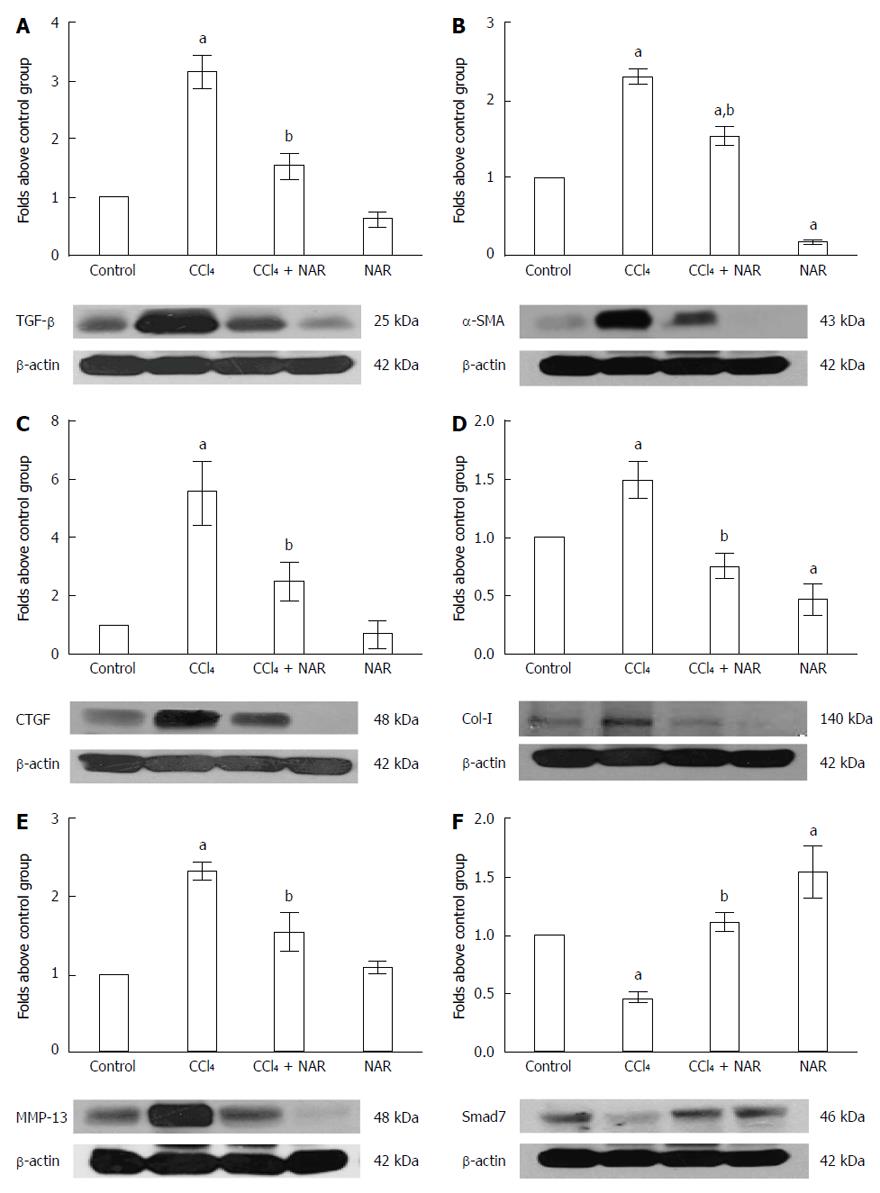
Figure 9 Naringenin prevents elevation of TGF-β, α-SMA, CTGF, MMP-13, and Col-1 protein levels, and preserves Smad7 protein levels in CCl4-treated rats.
The TGF-β (A), α-SMA (B), CTGF (C), MMP-13 (D), Col-1 (E) and Smad7 (F) protein levels in samples of liver tissue were determined by western blot analysis from control rats, carbon tetrachloride (CCl4)-treated rats, CCl4 plus naringenin rats (CCl4 + NAR), and rats administered with NAR alone (NAR). β-actin was used as a control. Values are expressed as fold increase of relative IOD normalized to the control group values (control = 1). Each bar represents the mean value of three rats ± SE. aP < 0.05 vs control group; bP < 0.05 vs CCl4 group.
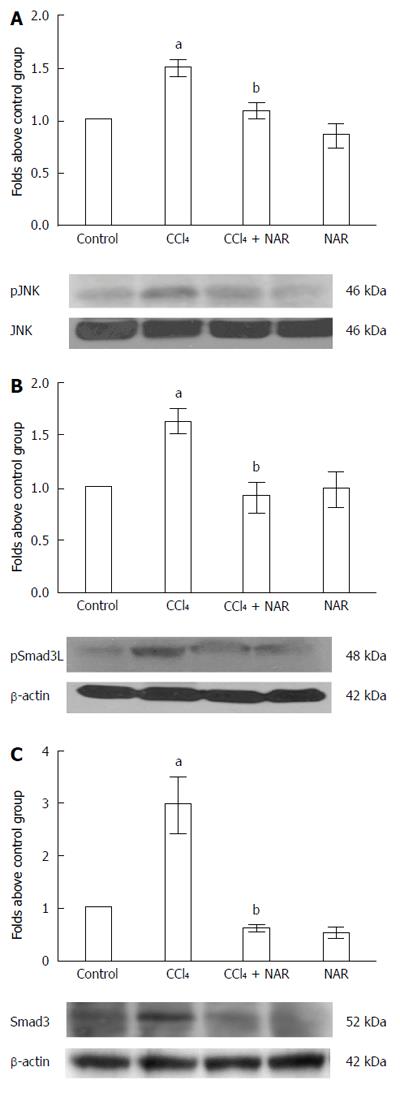
Figure 10 Naringenin prevents Smad3 linker phosphorylation by JNK inhibition in CCl4-treated rats.
pJNK (A) and pSmad3L protein activation (B) and Smad3 protein levels (C) in samples of liver tissue were determined by western blot analysis from control rats, carbon tetrachloride (CCl4)-treated rats, CCl4 plus naringenin rats (CCl4 + NAR), and rats administered with NAR alone (NAR). β-actin was used as a control. Values are expressed as fold increase of relative IOD normalized to the control group values (control = 1). Each bar represents the mean value of three rats ± SE. aP < 0.05 vs control group; bP < 0.05 vs CCl4 group.
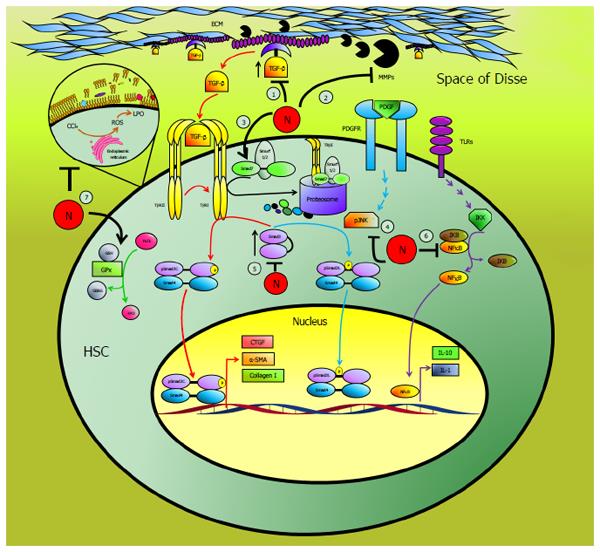
Figure 11 Schematic representation of the antifibrotic effect of naringenin.
Naringenin (N) may act at 7 levels to prevent liver fibrosis: (1) by maintaining basal TGF-β levels, thus, preventing hepatic stellate cells activation (HSC), (2) preserving normal metalloproteinases (MMPs) activity blocking TGF-β liberation from extracellular matrix (ECM), (3) increasing the inhibitory protein Smad7, (4) by blocking the activation of JNK, (5) preserving Smad3 levels within control values, (6) blocking the proinflammatory factor NF-κB, (7) by counteracting oxidative stress, preserving reduced glutathione (GSH) levels, glutathione peroxidase (GPx) activity and lipid peroxidation (LPO) induced by reactive oxygen species (ROS), within normal levels.
- Citation: Hernández-Aquino E, Zarco N, Casas-Grajales S, Ramos-Tovar E, Flores-Beltrán RE, Arauz J, Shibayama M, Favari L, Tsutsumi V, Segovia J, Muriel P. Naringenin prevents experimental liver fibrosis by blocking TGFβ-Smad3 and JNK-Smad3 pathways. World J Gastroenterol 2017; 23(24): 4354-4368
- URL: https://www.wjgnet.com/1007-9327/full/v23/i24/4354.htm
- DOI: https://dx.doi.org/10.3748/wjg.v23.i24.4354


