Copyright
©The Author(s) 2017.
World J Gastroenterol. Jun 7, 2017; 23(21): 3850-3863
Published online Jun 7, 2017. doi: 10.3748/wjg.v23.i21.3850
Published online Jun 7, 2017. doi: 10.3748/wjg.v23.i21.3850
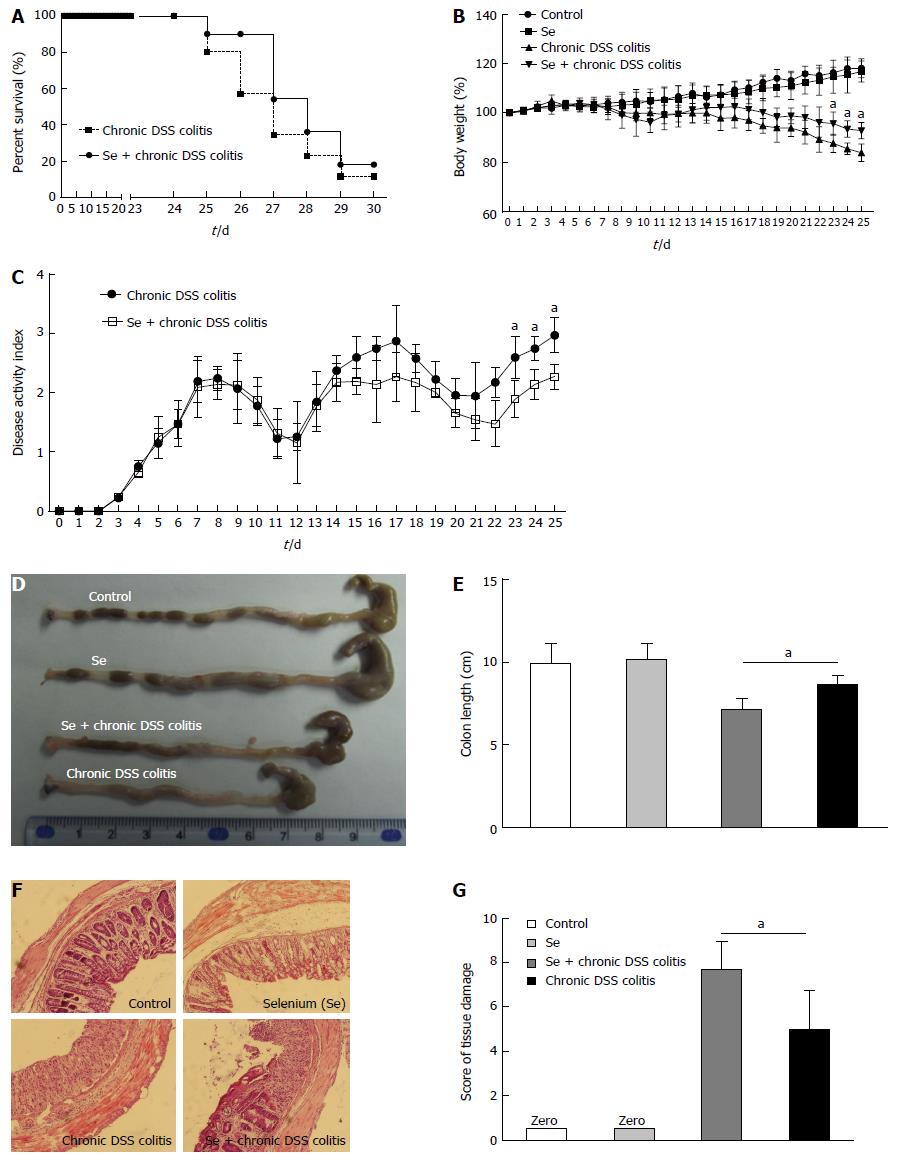
Figure 1 Sodium selenite ameliorates chronic dextran sulfate sodium-induced colitis in the C57BL/6 mice.
A: Survival rate; B: Changes in body weight (%); C: Changes in the disease activity index (DAI); D and E: Colon length; F and G: Colon histopathological injury scores. The data are presented as the mean ± SD (Se + chronic DSS colitis vs chronic DSS colitis, aP < 0.05) (n = 10). DSS: Dextran sulfate sodium.
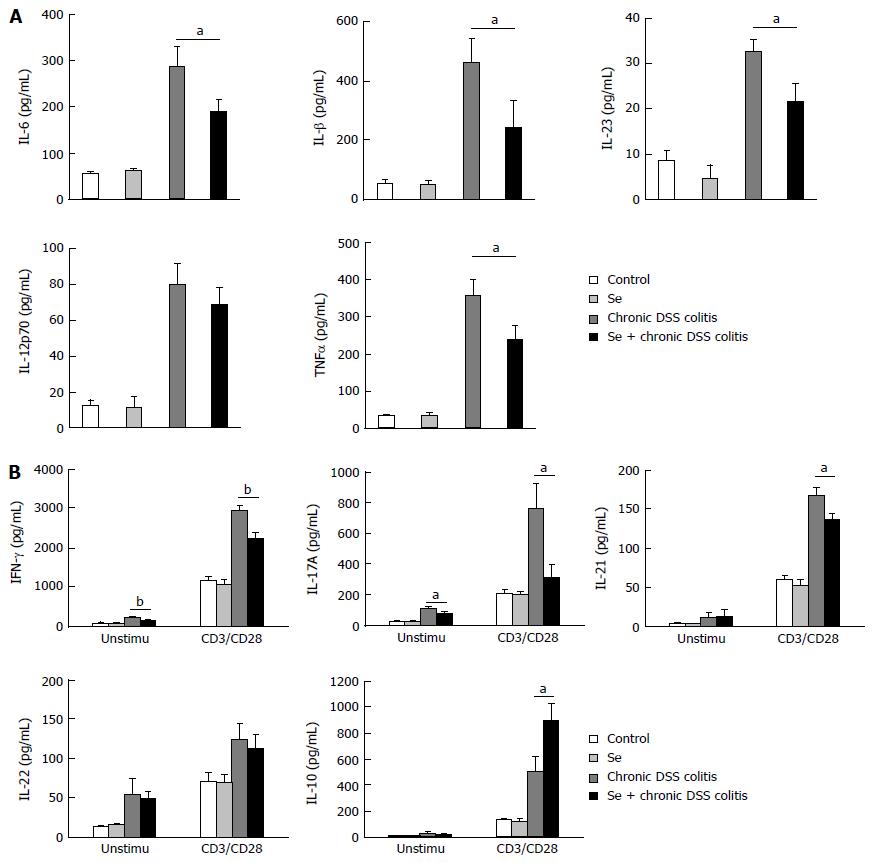
Figure 2 Cytokine production of LPL cells analyzed by ELISA.
A: Unstimulated cells; B: LPL cells with or without anti-CD3 and anti-CD28 mAbs (CD3/CD28) stimulations. Each group consisted of three mice. Values represent mean ± SD (aP < 0.05; bP < 0.01) (n = 3).
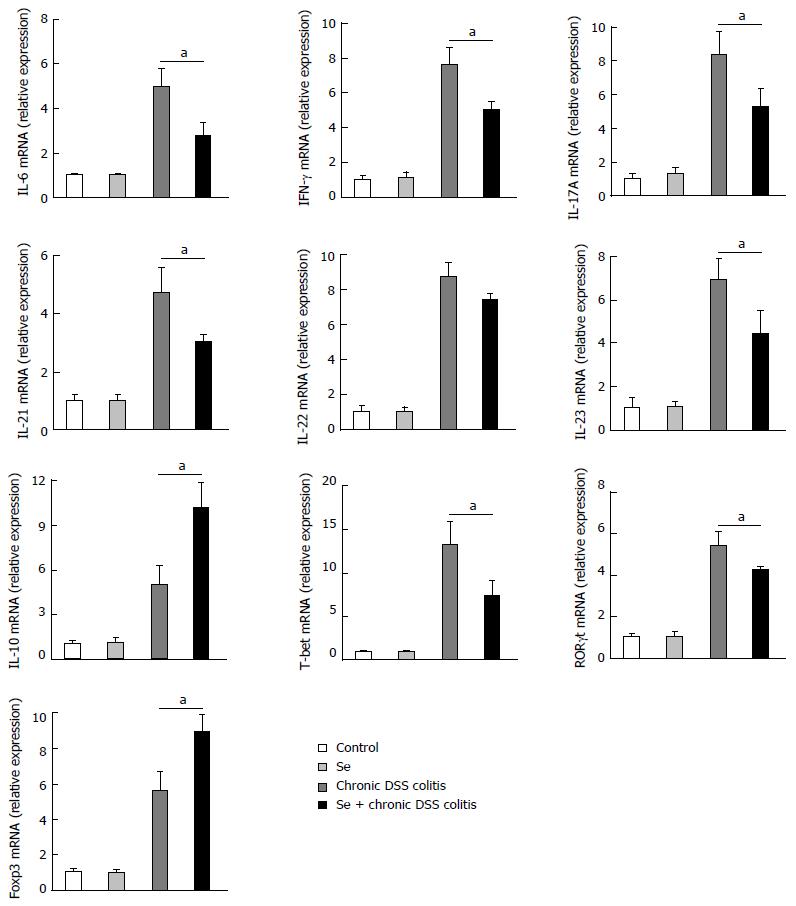
Figure 3 mRNA expression changes in colonic tissue.
Values represent mean ± SD (aP < 0.05) (n = 3).
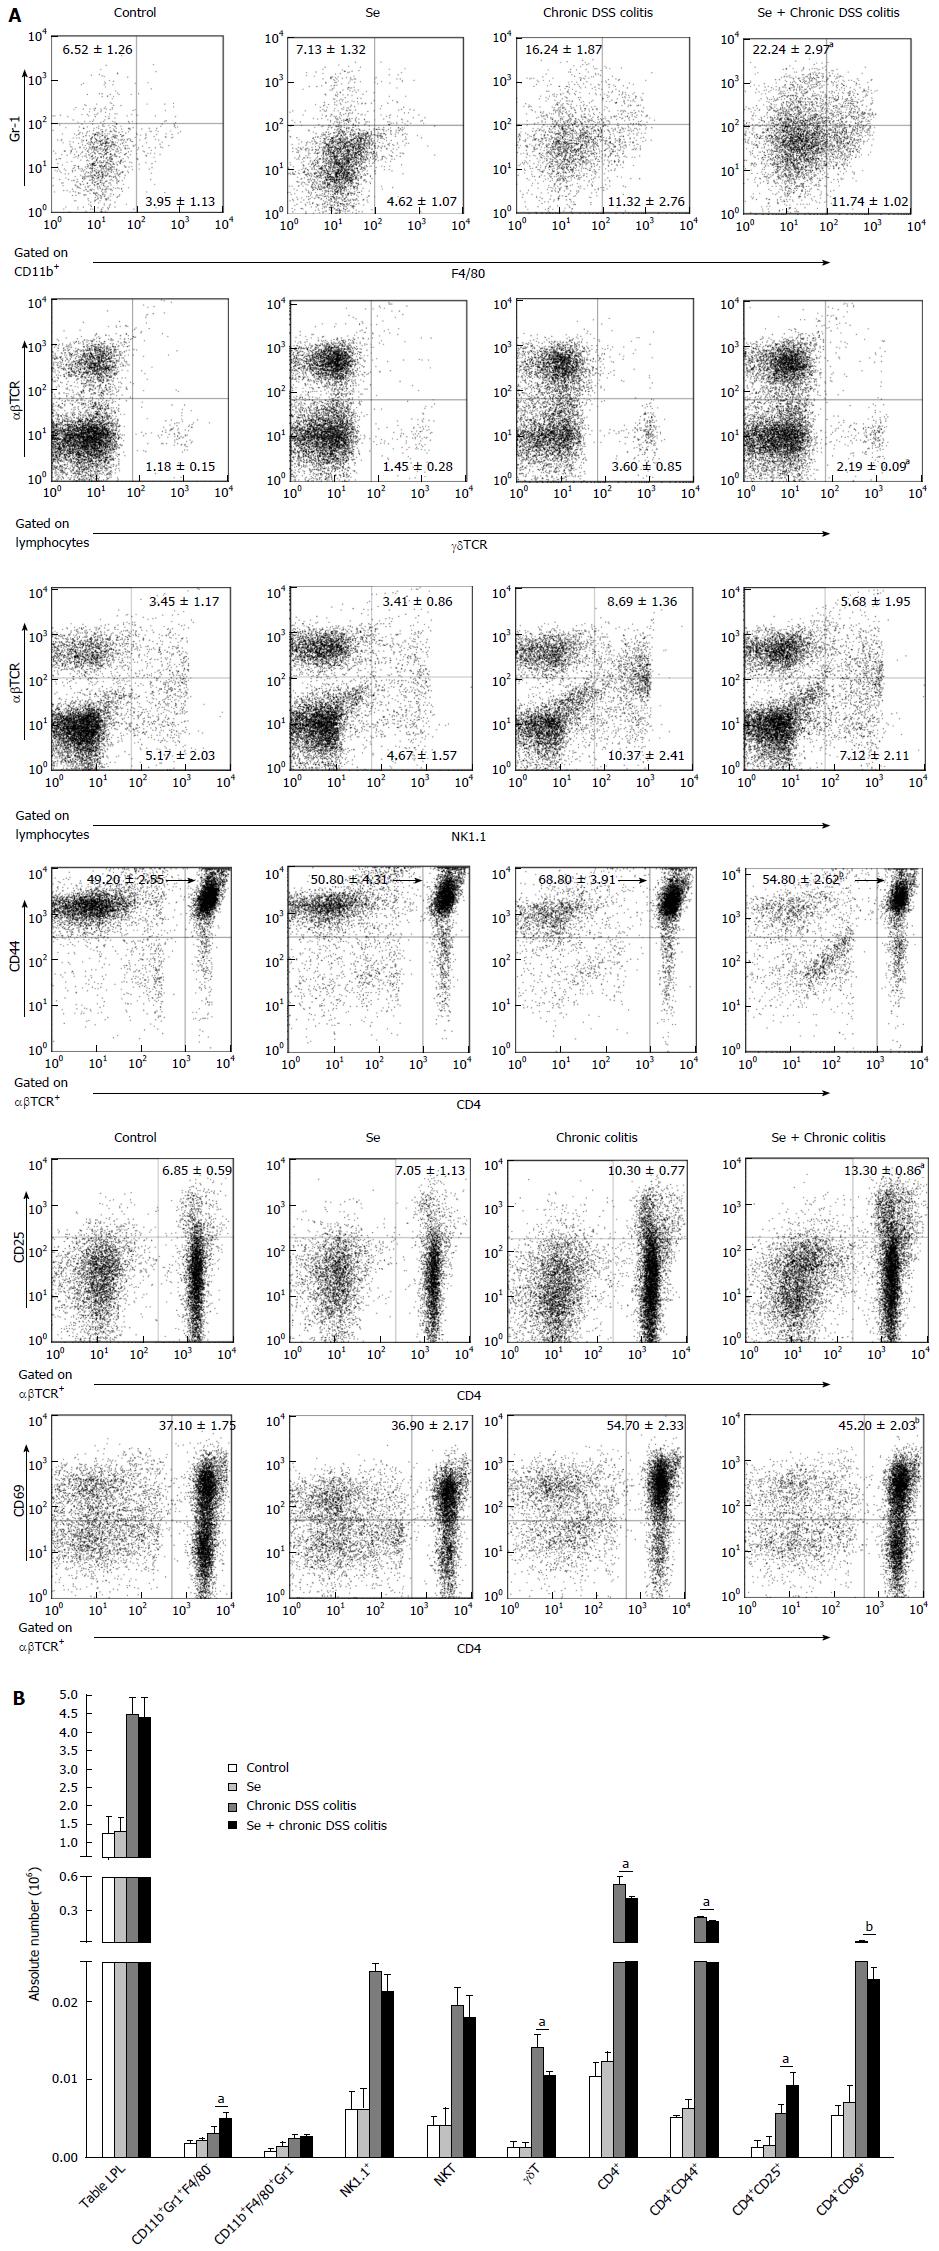
Figure 4 Flow cytometry of the populations of lamina propria lymphocytes in the colon in each group.
A: The frequencies of neutrophils (CD11b+Gr1+F4/80-), macrophages (CD11b+Gr1+F4/80+), γδT cells (γδTCR), NK cells (NK1.1+), NKT cells (NK1.1+αβTCR+), CD4+, CD4+CD44+ (effector T cells), CD4+CD25+ (regulatory T cells), CD4+CD69+ (activated T cells) T cells in LPL of the colon in each group; B: The absolute cell numbers of all kinds of cells in each group. Data indicate mean ± SD of six mice of obtained from a representative of three independent experiments (aP < 0.05, bP < 0.01).
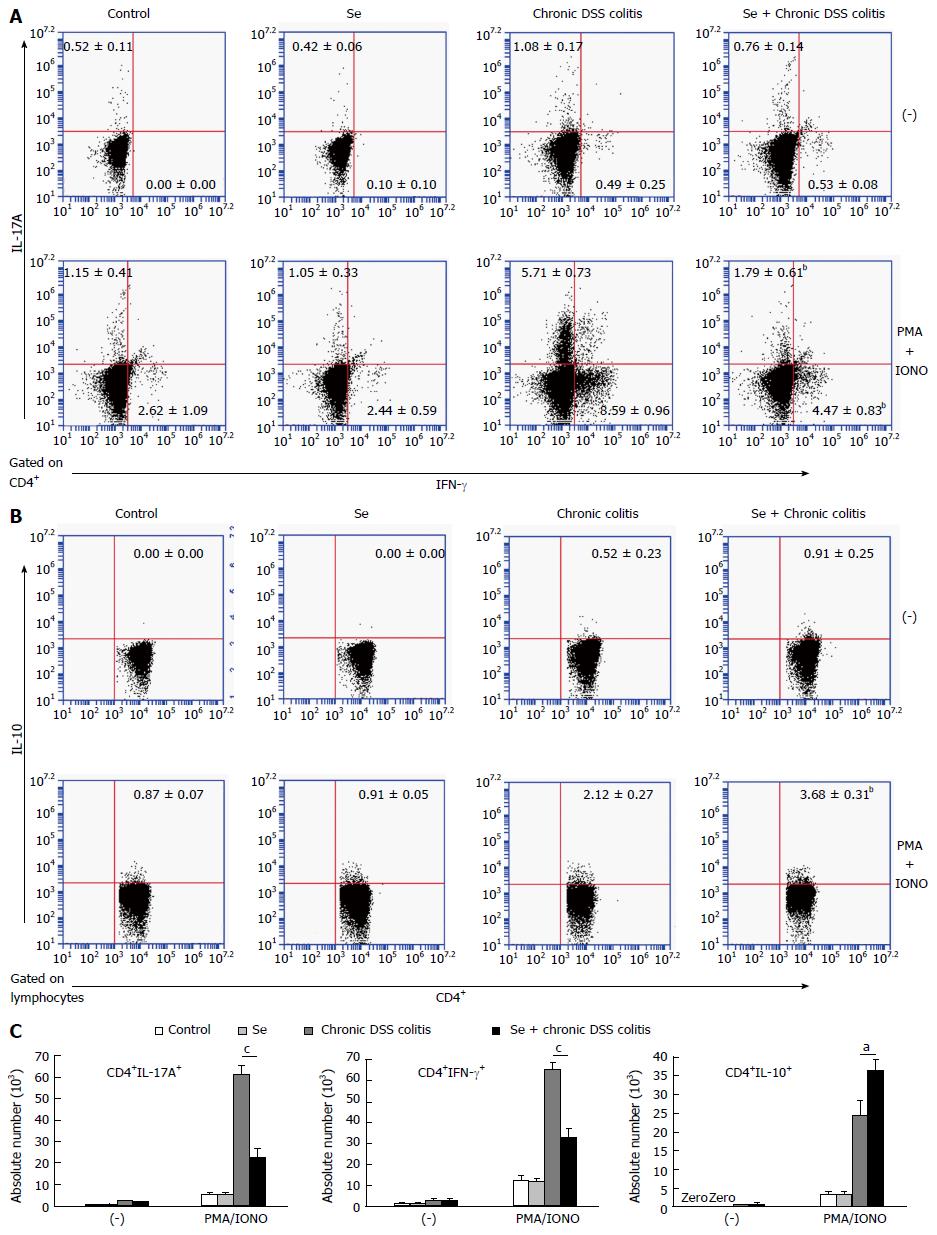
Figure 5 Cytokine-producing T cells in the lamina propria lymphocytes of the colon in each group.
A: The frequencies of CD4+IL-17A+ and CD4+IFN-γ+ T LPL. B: The frequency of CD4+IL-10+T LPL. C: The absolute numbers of cytokine producing CD4+IL-17A+, CD4+IFN-γ+ T LPL and CD4+IL-10+T LPL with and without stimulation. Data indicate mean ± SD of six mice of obtained from a representative of three independent experiments (aP < 0.05, bP < 0.01, cP < 0.001).
- Citation: Sang LX, Chang B, Zhu JF, Yang FL, Li Y, Jiang XF, Wang DN, Lu CL, Sun X. Sodium selenite ameliorates dextran sulfate sodium-induced chronic colitis in mice by decreasing Th1, Th17, and γδT and increasing CD4(+)CD25(+) regulatory T-cell responses. World J Gastroenterol 2017; 23(21): 3850-3863
- URL: https://www.wjgnet.com/1007-9327/full/v23/i21/3850.htm
- DOI: https://dx.doi.org/10.3748/wjg.v23.i21.3850


