Copyright
©The Author(s) 2017.
World J Gastroenterol. Jun 7, 2017; 23(21): 3805-3814
Published online Jun 7, 2017. doi: 10.3748/wjg.v23.i21.3805
Published online Jun 7, 2017. doi: 10.3748/wjg.v23.i21.3805
Figure 1 Effect of green tea polyphenols on alanine transaminase (A) and aspartate transaminase (B) in high-fat diet Zucker fatty rats.
Serum alanine transaminase (ALT) and aspartate transaminase (AST) concentrations were measured after 8 wk of daily treatment with saline (5 mL/kg; Lean, ZF-Con) or GTP (200 mg/kg; ZF-GTP). Data are means ± SEM, n = 12 rats/group. bP < 0.01 vs Lean rats and dP < 0.01 vs ZF-Con rats.
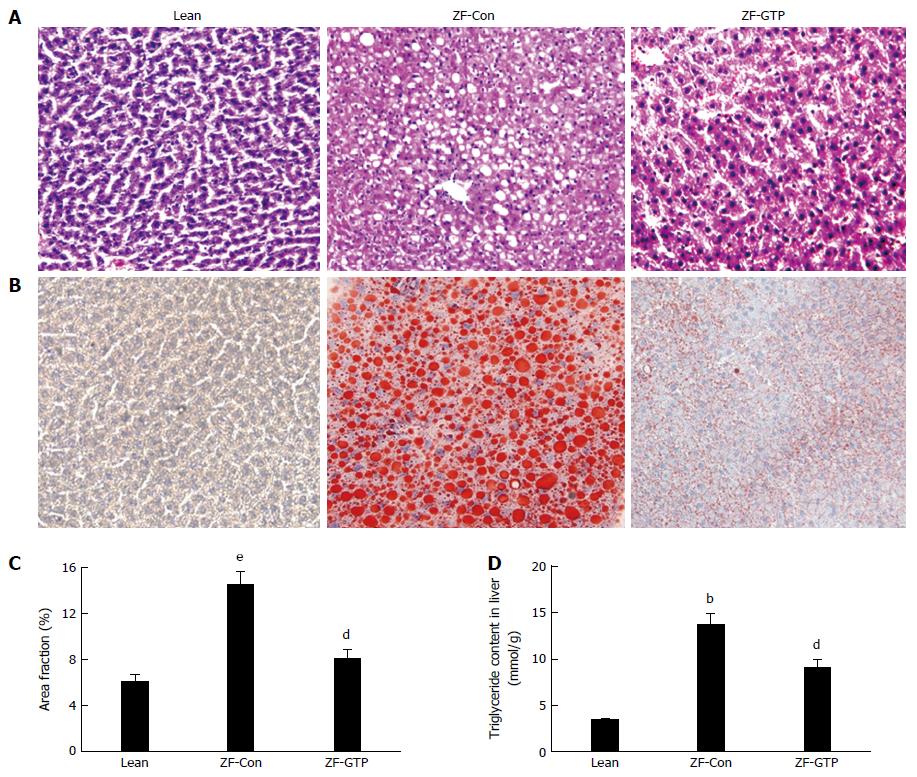
Figure 2 Reduction of hepatic steatosis and triglyceride content with green tea polyphenols treatment.
A: Images were stained with H&E to visualise macrovesicular steatosis in liver sections at × 400 magnification. Compared to the livers in lean control rats, a larger unstained area that consisted of fat vacuoles was seen in ZF control rats; B: Representative ORO staining of liver samples from lean, ZF-Con and ZF-GTP rats. A larger red area that consisted of lipid droplets (B, C: ORO staining; × 400 magnification) and higher triglyceride contents (D) in the livers of ZF-control rats. GTP treatment significantly reversed these changes in the liver. Data are expressed as mean ± SME from 6-8 rats each group. bP < 0.01, eP < 0.001 vs Lean group; dP < 0.01 vs ZF-Con group. GTP: Green tea polyphenols; ZF: Zucker fatty.
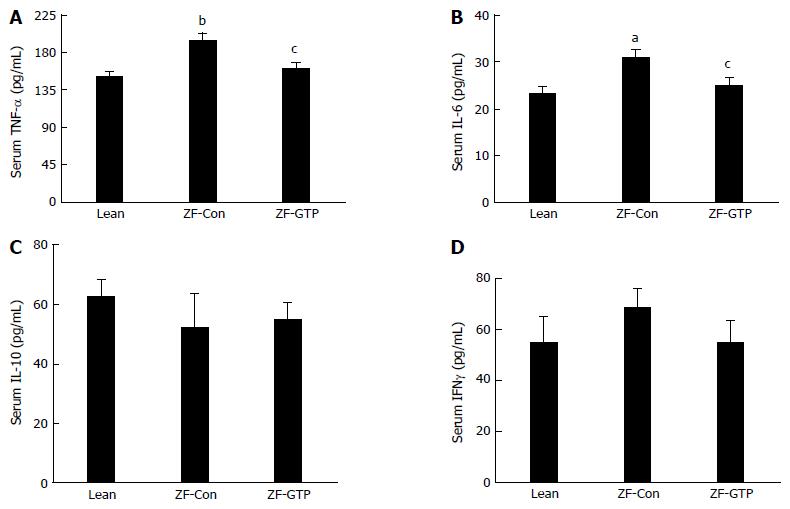
Figure 3 Effects of green tea polyphenols on inflammatory cytokines in circulation.
TNF-α (A), IL-6 (B), IL-10 (C) and IFNγ (D) levels in serum of lean, ZF-Con and ZF-GTP rats. Data are mean ± SEM from 12 rats each group. aP < 0.05 , bP < 0.01 vs lean group; cP < 0.05 vs ZF-Con group. GTP: Green tea polyphenols; ZF: Zucker fatty.
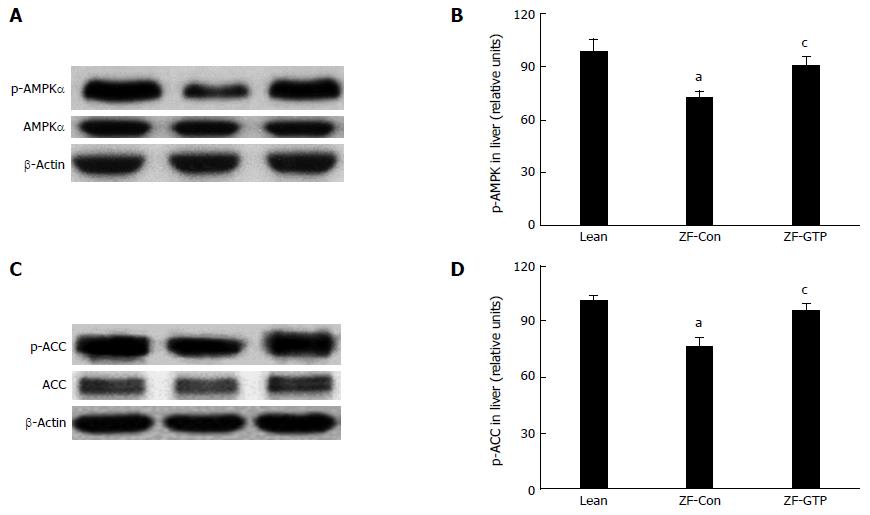
Figure 4 Effects of green tea polyphenols on de novo lipogenesis pathway in the liver of Zucker fatty rats.
Proteins extracted from the livers of lean, Zucker fatty (ZF)-Con. and ZF-GTP rats were separated by SDS-PAGE and immunoblotted with anti-p-AMPK-α, anti-AMPK-α, and anti-p-ACC: Anti-ACC. β-Actin was used to confirm equal protein loading. Upper panels (A and C): Immunoblot bands of detected proteins; lower panels (B and D): Quantitative analysis of corresponding proteins. Data are expressed as mean ± SME (n = 8). aP < 0.05 vs lean, cP < 0.05 vs ZF-Con. GTP: Green tea polyphenols; ACC: Acetyl-CoA carboxylase.
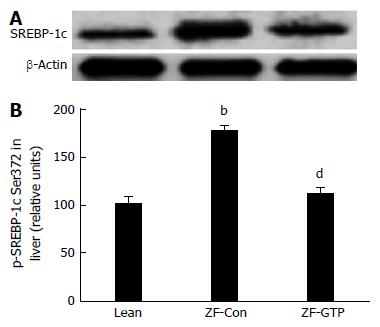
Figure 5 Expression of SREBP-1c in the liver of Zucker fatty rats.
Immunoblots (A) and quantitative analysis of (B) SREBP-1c in liver tissue of chow fed lean rats and HFD fed Zucker fatty (ZF) rats treated with saline (5 mL/kg of body weight) or with GTP (200 mg/kg of body weight). β-Actin was used to confirm equal protein loading. Data are expressed as mean ± SME (n = 8). bP < 0.01 vs lean, dP < 0.01 vs ZF-Con. GTP: Green tea polyphenols.
- Citation: Tan Y, Kim J, Cheng J, Ong M, Lao WG, Jin XL, Lin YG, Xiao L, Zhu XQ, Qu XQ. Green tea polyphenols ameliorate non-alcoholic fatty liver disease through upregulating AMPK activation in high fat fed Zucker fatty rats. World J Gastroenterol 2017; 23(21): 3805-3814
- URL: https://www.wjgnet.com/1007-9327/full/v23/i21/3805.htm
- DOI: https://dx.doi.org/10.3748/wjg.v23.i21.3805


