Copyright
©The Author(s) 2017.
World J Gastroenterol. May 21, 2017; 23(19): 3522-3529
Published online May 21, 2017. doi: 10.3748/wjg.v23.i19.3522
Published online May 21, 2017. doi: 10.3748/wjg.v23.i19.3522
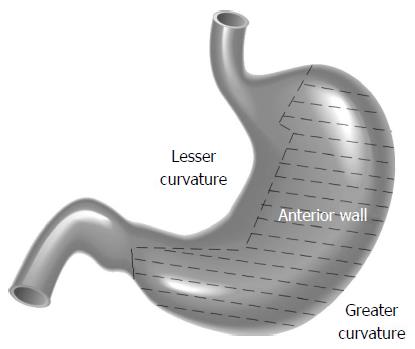
Figure 1 Illustration of favorable locations and unfavorable locations.
The hatched area shows favorable locations (also known as the easy-to-access area), and which includes tumors located on the greater curvature and anterior wall of the gastric body, fundus, and antrum. The unhatched area shows unfavorable locations (also known as the difficult-to-access area), and which includes tumors located in the lesser curvature of the body, fundus, and antrum, the cardia, or prepyloric region.
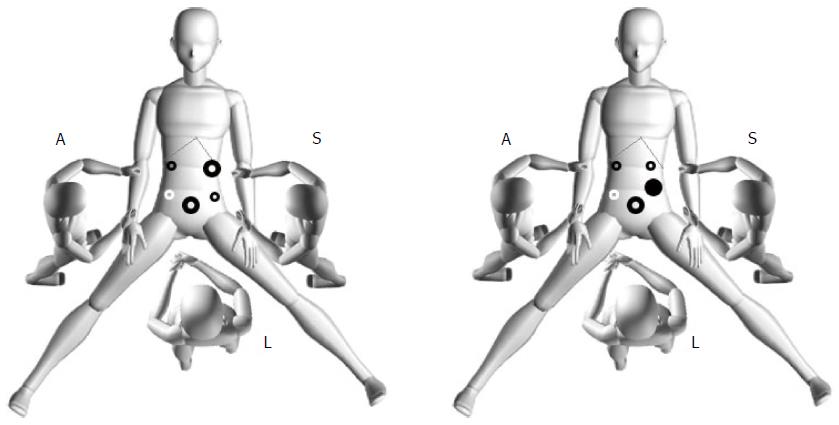
Figure 2 Operative positions and puncture trocars setting.
The surgeon stood on the patient’s left side with the assistant on the patient’s right side. The laparoscopist stood between the patient’s legs. A 12-mm trocar was inserted below the umbilicus, and used as the laparoscope port. One 10-mm trocar was placed 2 cm from the intersection of the right side of the outer rectus and under the costal margin was used as the dominant hand port. One 5-mm trocar was placed 2 cm from the intersection of the right side of the outer rectus and the umbilicus. Two additional 5-mm trocars were placed in the contralateral side, including a third (white circle) when necessary. When performing laparoscopic intragastric submucosal dissection, the laparoscope port position is shown in the figure on the right as a 12-mm trocar (black solid circle) that was inserted intragastrically with a laparoscopic monitor and changed to an intragastric monitor port.
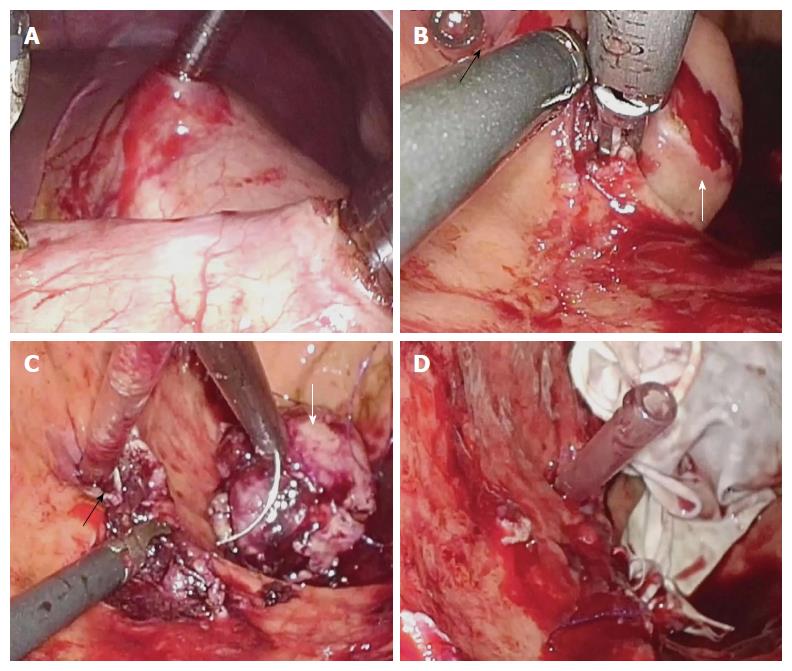
Figure 3 Laparoscopic intragastric submucosal dissection for gastrointestinal stromal tumor.
A: Insertion of trocars into the stomach cavity under laproscopic view; B and C: Striping of the tumor (white arrow) from the gastric submucosal layer and suturing of the gastric wall incision in the stomach cavity (ostium pyloricum was indicated with black arrow); D: Removal of the tumor with the specimen bag through stomach wall and abdominal wall.
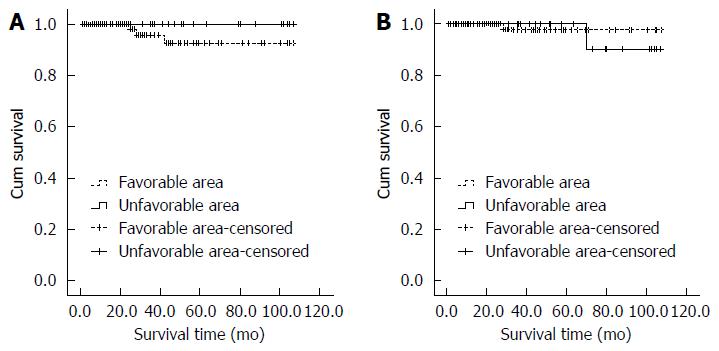
Figure 4 Disease-free survival curves (A) and survival curves (B) of the two groups.
- Citation: Liao GQ, Chen T, Qi XL, Hu YF, Liu H, Yu J, Li GX. Laparoscopic management of gastric gastrointestinal stromal tumors: A retrospective 10-year single-center experience. World J Gastroenterol 2017; 23(19): 3522-3529
- URL: https://www.wjgnet.com/1007-9327/full/v23/i19/3522.htm
- DOI: https://dx.doi.org/10.3748/wjg.v23.i19.3522


