Copyright
©The Author(s) 2017.
World J Gastroenterol. May 21, 2017; 23(19): 3427-3439
Published online May 21, 2017. doi: 10.3748/wjg.v23.i19.3427
Published online May 21, 2017. doi: 10.3748/wjg.v23.i19.3427
Figure 1 CRL.
1790 cells produce IL-8, but not TNFα and IL-1β in response to microbial stimulation. CRL.1790 cells were stimulated with heat-killed cecal contents (HKC) or heat-killed E. coli for 6 and 12 h. Cellular supernatants were collected and assayed for the production IL-8 (A), TNFα (B) and IL-1β (C) using ELISA (n = 3). bP < 0.01 vs Control. Data are expressed as mean ± SE.
Figure 2 CRL.
1790 cells generates robust reactive oxygen species upon microbial stimulation. CRL.1790 cells were stimulated with heat killed cecal contents (HKC) or heat killed E. coli for 6 h and 12 h. A: Fluorescence intensity of the CRL.1790 cells preloaded with carboxy-H2DCFDA dye; B: CellROX staining intensity (CTCF- corrected total cell fluorescence) was measured to determine ROS generation in CRL.1790 cells (n = 3). bP < 0.01 vs Control. Data are expressed as mean ± SE. ROS: Reactive oxygen species; CTCF: Corrected total cell fluorescence.
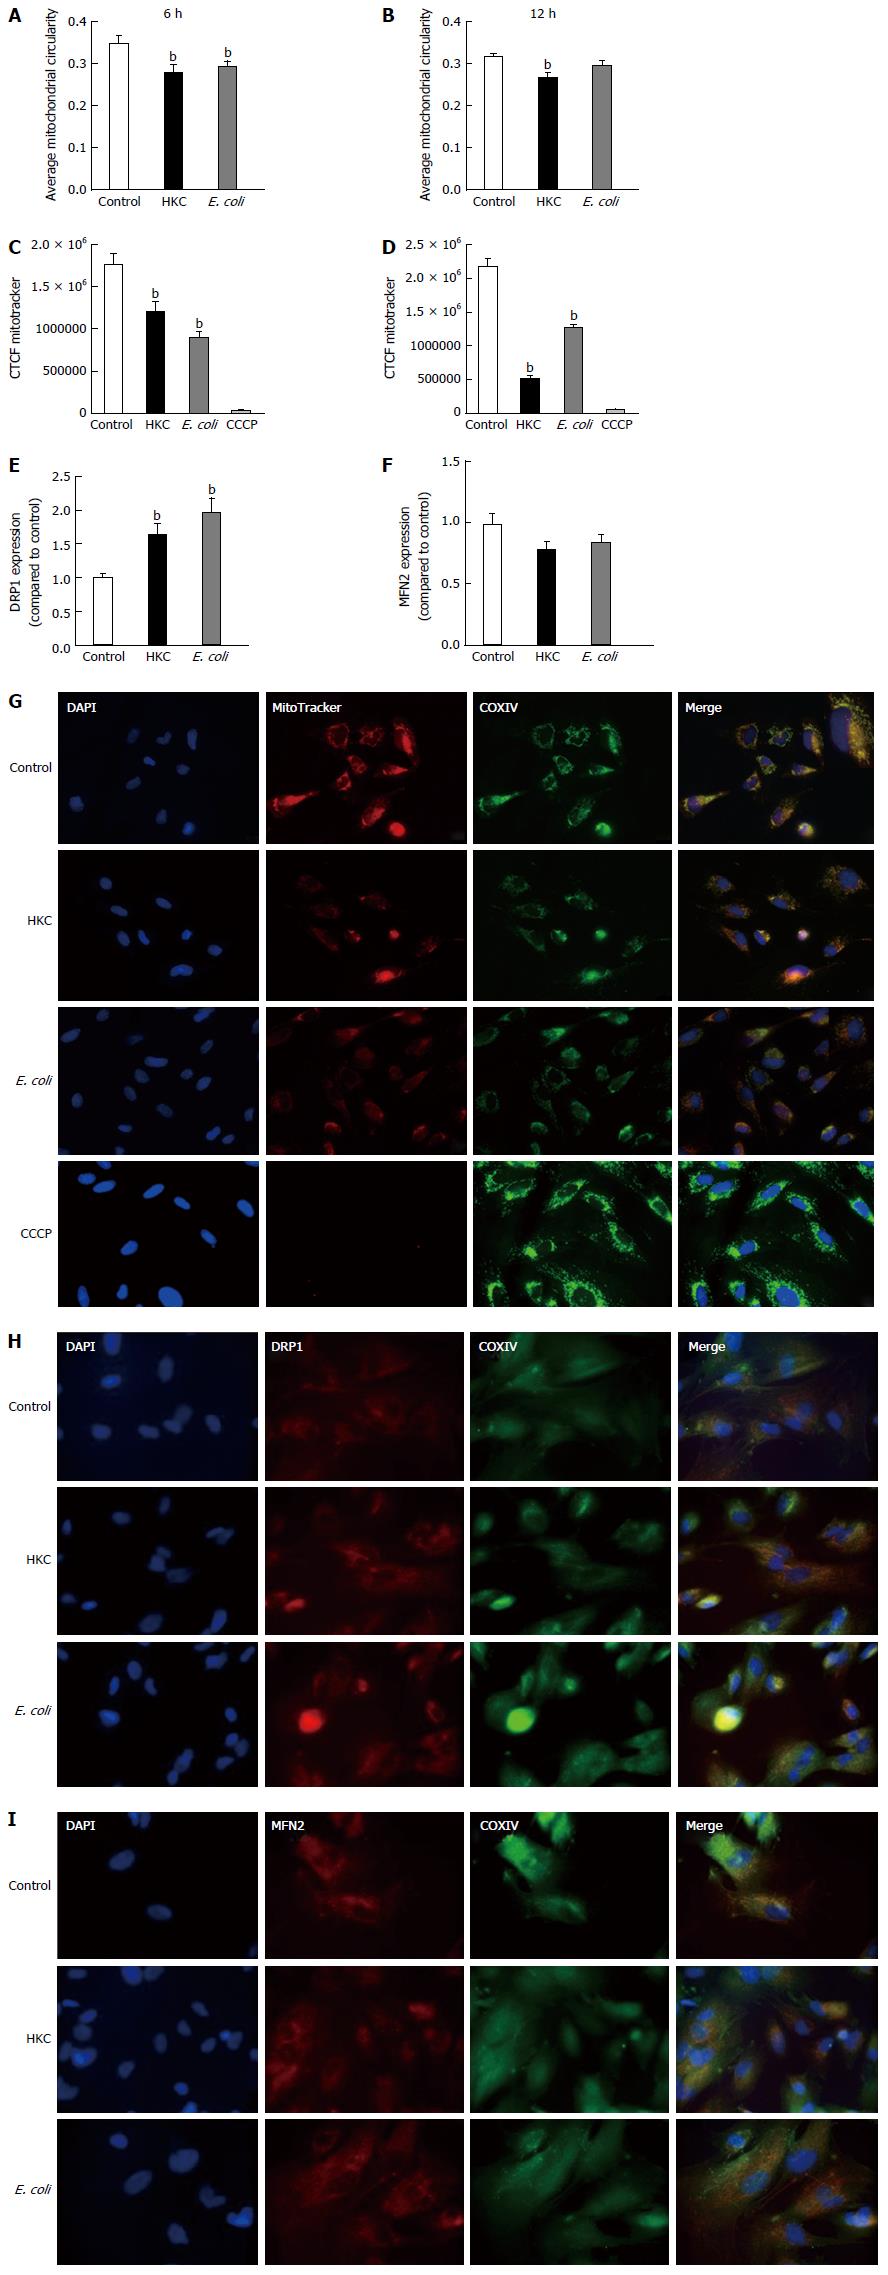
Figure 3 Mitochondrial dysfunction in CRL.
1790 cells is evident during microbial stimulation. CRL.1790 cells stimulated with heat killed cecal contents (HKC) or heat killed E. coli for 6 h and 12 h were assessed for mitochondrial function using mitotracker staining. A and B: Denotes average circularity of mitochondria assessed 6 h and 12 h post stimulation respectively; C and D: Denotes intensity of mitotacker staining in cells 6 h and 12 h post stimulation respectively; E and F: Expression of DRP1 and MFN2 in CRL.1790 cells treated with HKC or E.coli for 6 h and 12 h post stimulation respectively; G: Representative images showing mitotracker staining (n = 3) (magnification × 60); H and I: Representative images showing expression of Drp1 and MFN2 (magnification × 60). bP < 0.01 vs Control. Data are expressed as mean ± SE. CTCF: Corrected total cell fluorescence; CCCP: Carbonyl cyanide 3-cholorphenylhydrazone.
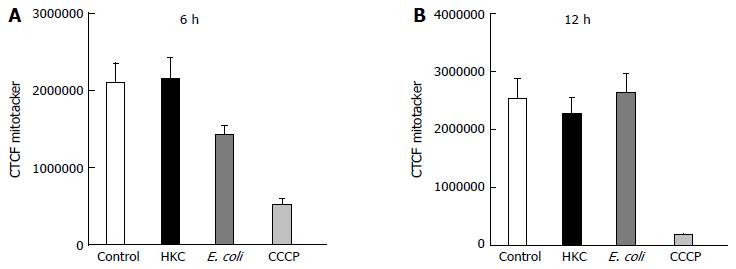
Figure 4 Mitochondrial reactive oxygen species scavenging ameliorates mitochondrial damage in CRL.
1790. CRL.1790 cells pretreated with mitoTempo (Mitochondria specific reactive oxygen species scavenger), stimulated with heat killed cecal contents (HKC) or heat killed E. coli for 6 h and 12 h were assessed for mitochondrial function using mitotracker staining. A and B: Denotes intensity of mitotacker staining in cells 6 h and 12 h post stimulation respectively (n = 3). Data are expressed as mean ± SE. CTCF: Corrected total cell fluorescence; CCCP: Carbonyl cyanide 3-cholorphenylhydrazone.
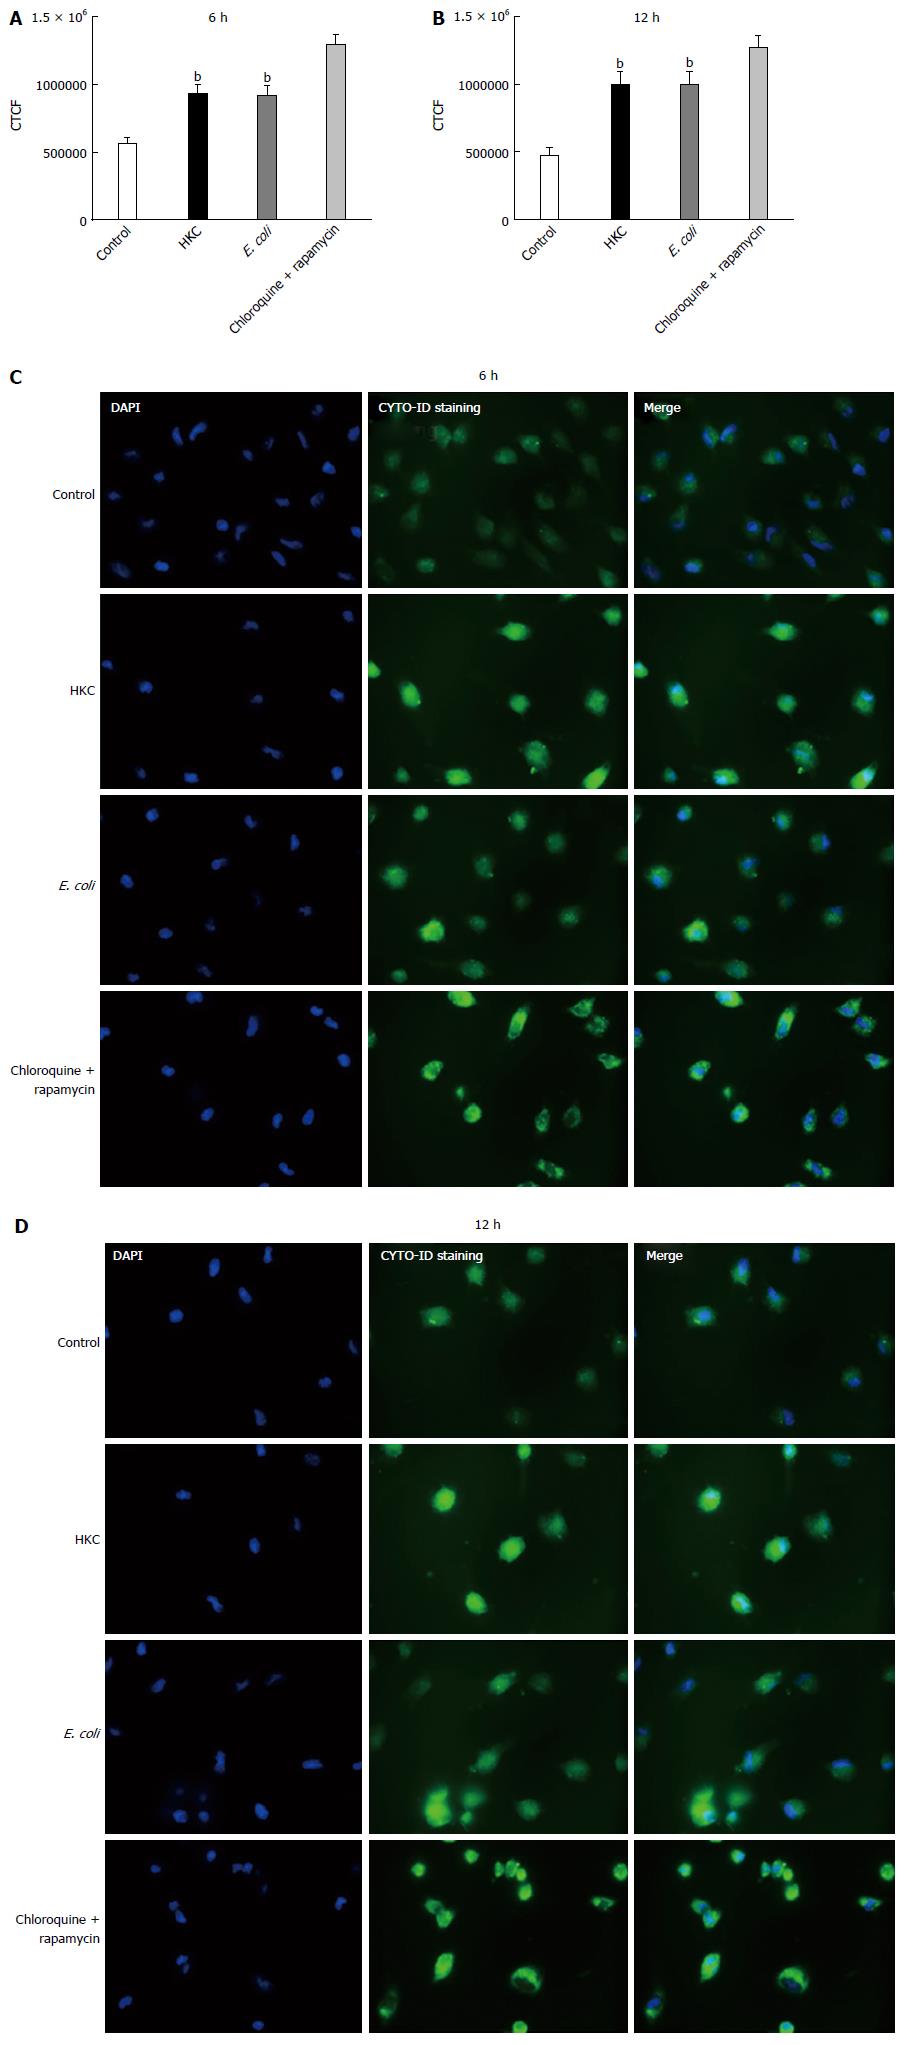
Figure 5 Increased autophagy observed in CRL.
1790 cells with microbial stimulation. A and B: CRL.1790 cells stimulated with heat killed cecal contents (HKC) or heat killed E. coli for 6 h and 12 h were assessed for presence of autophagic vesicles using ENZO cytoID (n = 3). Chloroquine and rapamycin treated cells were used as positive control; C and D: Representative images showing staining of autophagic vesicles (magnification × 40). bP < 0.01 vs Control. Data are expressed as mean ± SE. CTCF: Corrected total cell fluorescence.
- Citation: Packiriswamy N, Coulson KF, Holcombe SJ, Sordillo LM. Oxidative stress-induced mitochondrial dysfunction in a normal colon epithelial cell line. World J Gastroenterol 2017; 23(19): 3427-3439
- URL: https://www.wjgnet.com/1007-9327/full/v23/i19/3427.htm
- DOI: https://dx.doi.org/10.3748/wjg.v23.i19.3427


