Copyright
©The Author(s) 2017.
World J Gastroenterol. May 7, 2017; 23(17): 3174-3183
Published online May 7, 2017. doi: 10.3748/wjg.v23.i17.3174
Published online May 7, 2017. doi: 10.3748/wjg.v23.i17.3174
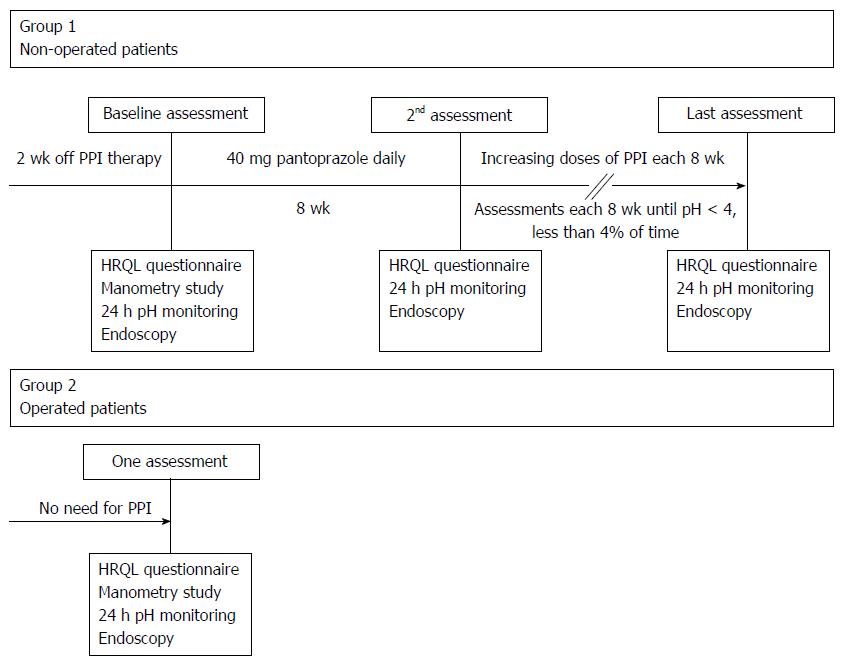
Figure 1 Study flow-chart.
PPI: Proton pump inhibitors.
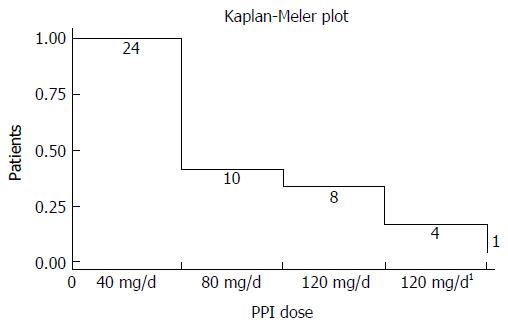
Figure 2 Normalization of acid reflux in response to escalating doses of pantoprazole in non-operated patients with Barrett’s esophagus.
1Three patients achieved normalization after switching to esomeprazole 120 mg/d; normalization did not occur in one patient. PPI: Proton pump inhibitors.
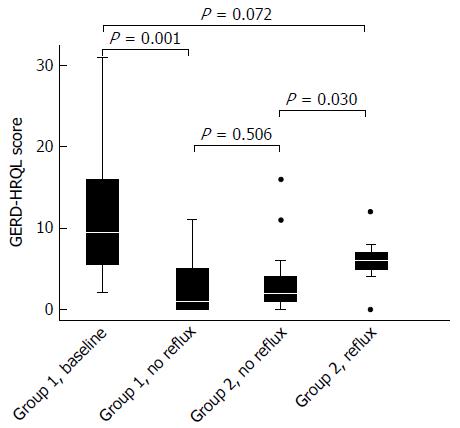
Figure 3 Gastroesophageal reflux disease-health related quality of life scores in patients with Barrett’s esophagus at baseline and after increasing doses of proton pump inhibitor in the non-operated (group 1) and after anti-reflux surgery (group 2).
Group 2 was subdivided into those with and without normal acid reflux. Medians, 25%-75% quartiles and 10%-90% ranges. GERD/HRQL: Gastroesophageal reflux disease-health related quality of life.
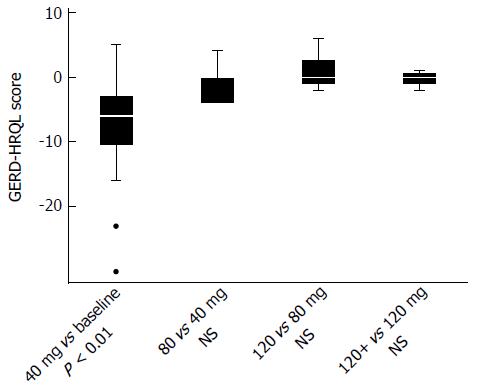
Figure 4 Gastroesophageal reflux disease-health related quality of life score in patients with Barrett’s esophagus related to changes in total acidic reflux.
Medians, 25%-75% quartiles and 10%-90% ranges. GERD-HRQL: Gastroesophageal reflux disease-health related quality of life; BE: Barrett’s esophagus.
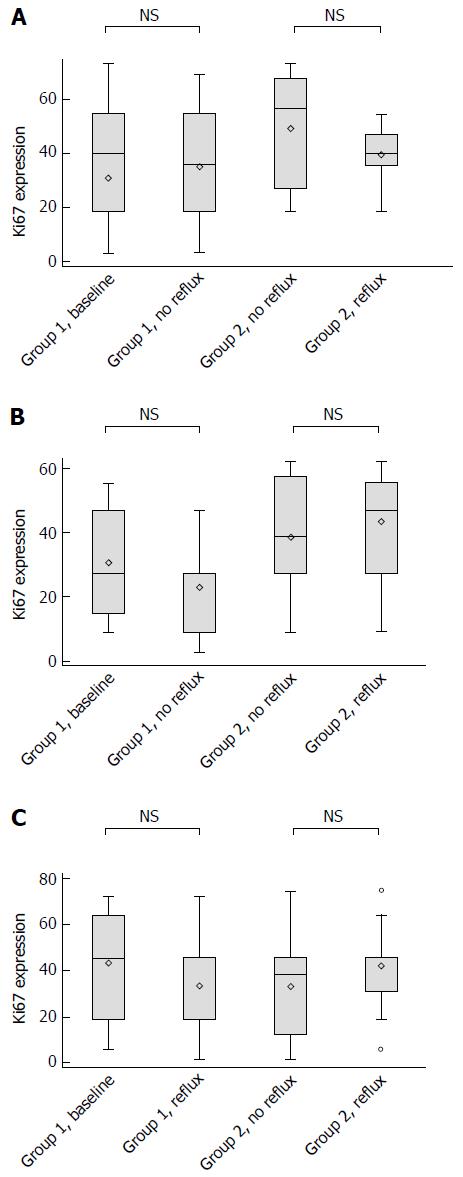
Figure 5 Ki67 expression in patients with Barrett’s esophagus at increasing doses of proton pump inhibitor in non-operated patients (group 1) and after anti-reflux surgery (group 2).
Group 2 was subdivided into those with and without normal acid reflux. (1) Distal columnar lined esophagus (CLE) near gastroesophageal junction; (2) proximal CLE; and (3) distal squamous epithelium. Medians, 25%-75% quartiles and 10%-90% ranges.
- Citation: Baldaque-Silva F, Vieth M, Debel M, Håkanson B, Thorell A, Lunet N, Song H, Mascarenhas-Saraiva M, Pereira G, Lundell L, Marschall HU. Impact of gastroesophageal reflux control through tailored proton pump inhibition therapy or fundoplication in patients with Barrett’s esophagus. World J Gastroenterol 2017; 23(17): 3174-3183
- URL: https://www.wjgnet.com/1007-9327/full/v23/i17/3174.htm
- DOI: https://dx.doi.org/10.3748/wjg.v23.i17.3174


