Copyright
©The Author(s) 2017.
World J Gastroenterol. May 7, 2017; 23(17): 3099-3110
Published online May 7, 2017. doi: 10.3748/wjg.v23.i17.3099
Published online May 7, 2017. doi: 10.3748/wjg.v23.i17.3099
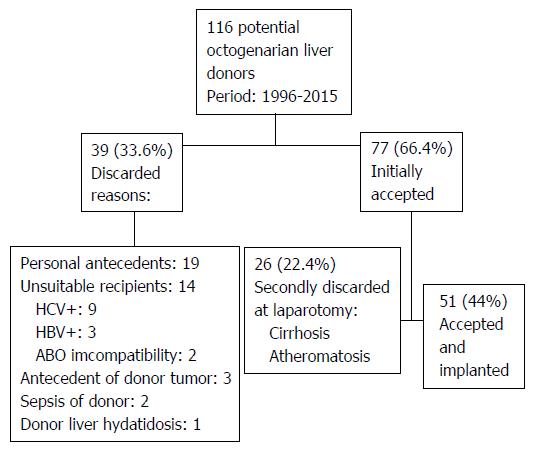
Figure 1 Process of evaluation and acceptance of octogenarian liver grafts.
HCV: Hepatitis C virus; HBV: Hepatitis B virus.
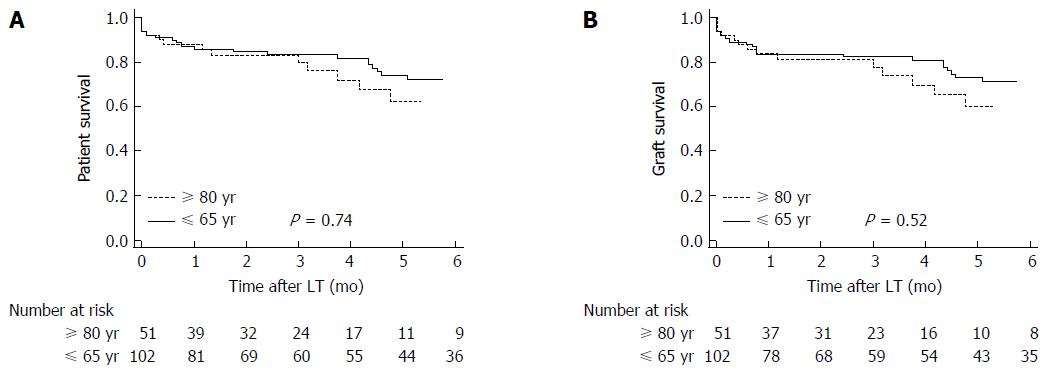
Figure 2 Comparison of overall patient and graft survival at 1, 3 and 5-yr, between recipients of livers < 65 years old (group A; n = 102) and recipients of octogenarian liver grafts (group B; n = 51).
Log-rank test for a difference in patient survival curves showed a P = 0.74 (A), whereas for a graft survival curves showed a P = 0.52 (B). LT: Liver transplantation.
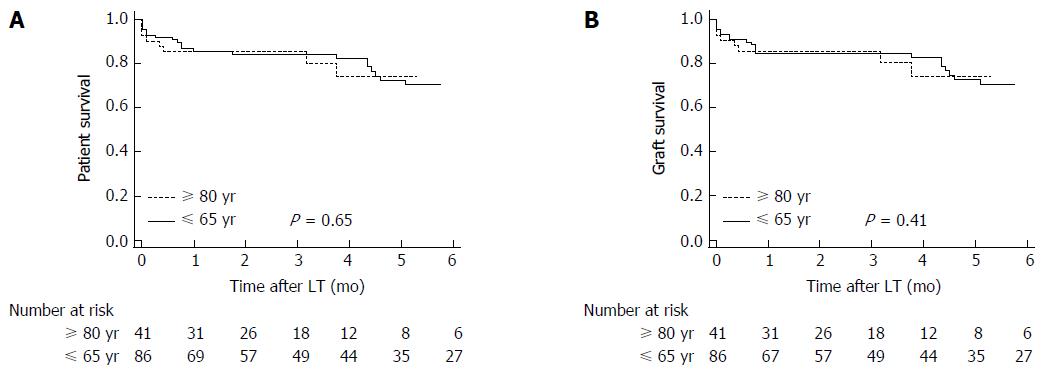
Figure 3 Comparison of patient and graft survival at 1, 3 and 5-yr in recipients who underwent liver transplantation for non-hepatitis C virus cirrhosis.
An overall of 26 patients of this series were excluded in this analysis because of hepatitis C virus cirrhosis (10 patients in the group of octogenarian livers, and 16 in the group < 65 years old). Log-rank test for a difference in patient survival curves showed a P = 0.65 (A), whereas for a graft survival curves showed a P = 0.41 (B). LT: Liver transplantation.
- Citation: Jiménez-Romero C, Cambra F, Caso O, Manrique A, Calvo J, Marcacuzco A, Rioja P, Lora D, Justo I. Octogenarian liver grafts: Is their use for transplant currently justified? World J Gastroenterol 2017; 23(17): 3099-3110
- URL: https://www.wjgnet.com/1007-9327/full/v23/i17/3099.htm
- DOI: https://dx.doi.org/10.3748/wjg.v23.i17.3099


