Copyright
©The Author(s) 2017.
World J Gastroenterol. May 7, 2017; 23(17): 3066-3076
Published online May 7, 2017. doi: 10.3748/wjg.v23.i17.3066
Published online May 7, 2017. doi: 10.3748/wjg.v23.i17.3066
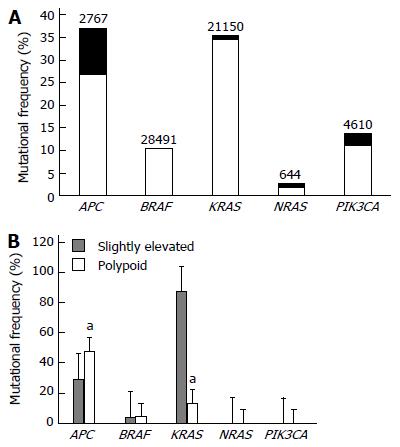
Figure 1 Comparative mutational analysis of commonly mutated genes.
A: Total coverage of the five commonly-mutated genes under investigation based on the Catalogue of Somatic Mutations in Cancer (COSMIC) database. The solid bars represent the overall mutational percentages according to the COSMIC database, while the hashed bars represent the subset of mutational percentages covered under the current study. The total numbers of samples analyzed by the COSMIC database are stated on top of each bar. B: Among the five genes analyzed, APC and KRAS were the most frequently mutated genes in both lesions. Slightly elevated lesions showed a significantly lower APC mutational frequency as well as a significantly higher KRAS mutational frequency relative to polypoid lesions. aP < 0.05, slightly elevated vs polypoid.
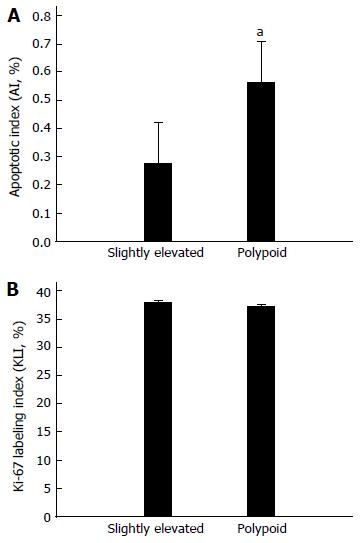
Figure 2 Gross apoptosis and proliferation indices.
A: Slightly elevated lesions demonstrated a significantly lower apoptosis index relative to polypoid lesions. B: There was no significant difference in the Ki-67 labeling index between the two lesion types. aP < 0.05, slightly elevated vs polypoid.
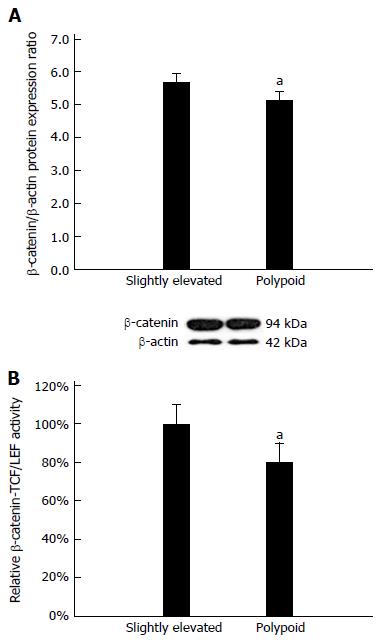
Figure 3 β-catenin pathway analysis.
A: Western blotting revealed that β-catenin protein expression was significantly upregulated in slightly elevated lesions relative to polypoid lesions. B: A dual-luciferase reporter assay using an STF construct (containing a firefly luciferase reporter driven by several TCF/LEF consensus binding sites) revealed significant upregulation of β-catenin-TCF/LEF-driven transcriptional activity in slightly elevated lesions relative to polypoid lesions. aP < 0.05, slightly elevated vs polypoid.
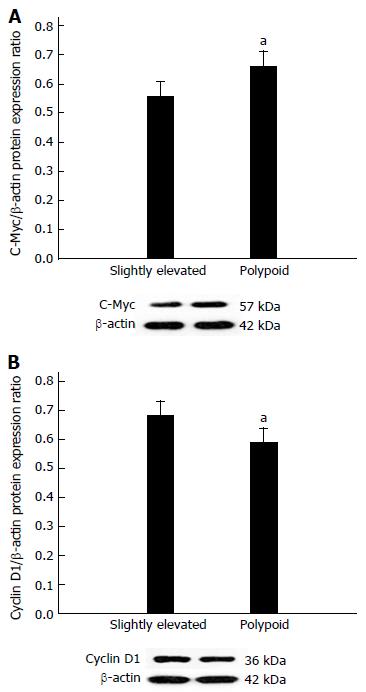
Figure 4 C-Myc and cyclin D1 expression analysis.
A: C-Myc protein expression was significantly downregulated in slightly elevated lesions relative to polypoid lesions. B: Cyclin D1 protein expression was significantly upregulated in slightly elevated lesions relative to polypoid lesions. aP < 0.05, slightly elevated vs polypoid.
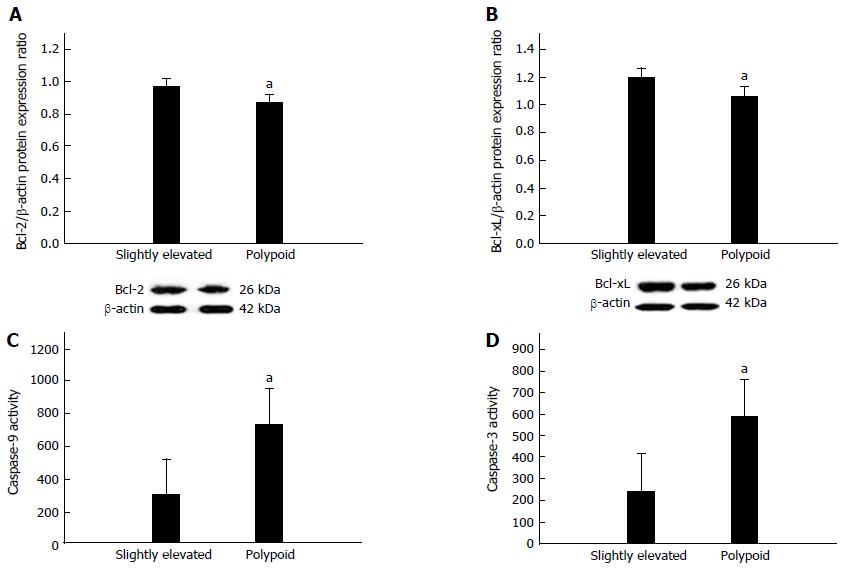
Figure 5 Markers of downstream apoptosis signaling.
Bcl-2 (A) and Bcl-xL (B) protein expression were significantly upregulated in slightly elevated lesions relative to polypoid lesions. Caspase-9 (C) and caspase-3 (D) activity were both significantly downregulated in slightly elevated lesions relative to polypoid lesions. aP < 0.05, slightly elevated vs polypoid.
- Citation: Yang TW, Gao YH, Ma SY, Wu Q, Li ZF. Low-grade slightly elevated and polypoid colorectal adenomas display differential β-catenin-TCF/LEF activity, c-Myc, and cyclin D1 expression. World J Gastroenterol 2017; 23(17): 3066-3076
- URL: https://www.wjgnet.com/1007-9327/full/v23/i17/3066.htm
- DOI: https://dx.doi.org/10.3748/wjg.v23.i17.3066


