Copyright
©The Author(s) 2017.
World J Gastroenterol. Apr 28, 2017; 23(16): 2928-2939
Published online Apr 28, 2017. doi: 10.3748/wjg.v23.i16.2928
Published online Apr 28, 2017. doi: 10.3748/wjg.v23.i16.2928
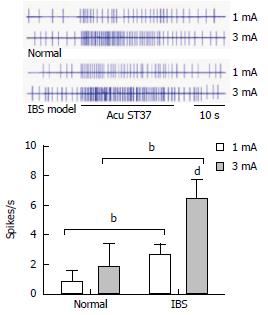
Figure 1 Effects of electro-acupuncture with different current intensities on the activation of wide dynamic range neurons in the dorsal horn of the spinal cord.
bP < 0.01, vs the NC group; dP < 0.01, vs EA 1 mA group. IBS: Irritable bowel syndrome.
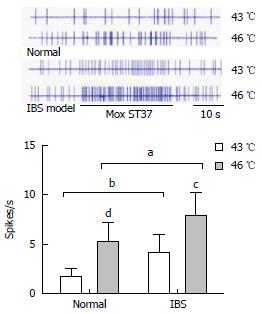
Figure 2 Effects of moxibustion with different temperatures on the activation of wide dynamic range neurons in the dorsal horn of the spinal cord.
aP < 0.05, bP < 0.01, vs the NC group; cP < 0.05, dP < 0.01, vs Mox 43 °C group. Mox: Moxibustion.
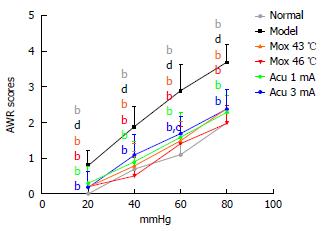
Figure 3 Abdominal withdrawal reflex scores comparison.
bP < 0.01, vs the MC group; cP < 0.05, dP < 0.01, vs the NC group.
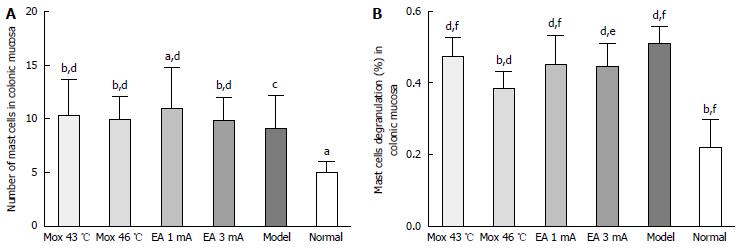
Figure 4 Change of mast cells activity in the colon.
A: Number of mast cells in colonic mucosa, aP < 0.05, bP < 0.01, vs the MC group; cP < 0.05, dP < 0.01, vs the NC group; B: Mast cells degranulation(%) in colonic mucosa. bP < 0.01, vs the MC group; dP < 0.01 vs the NC group; eP < 0.05, fP < 0.01, vs the Mox 46 °C group.
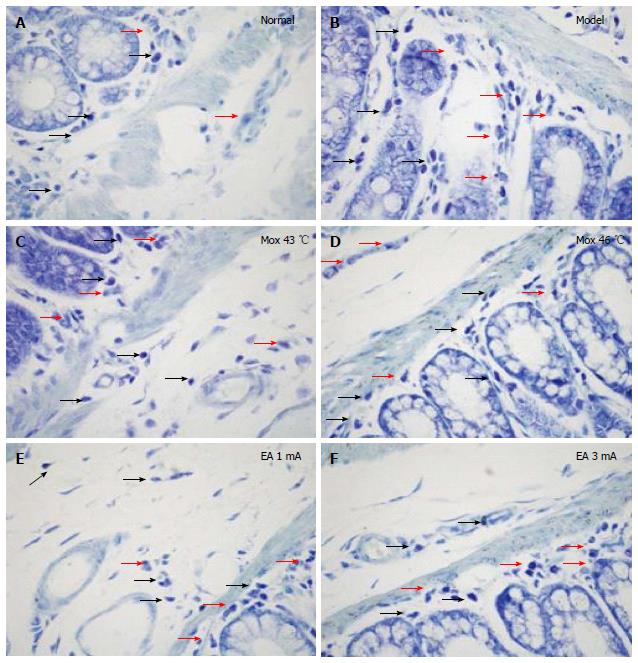
Figure 5 Change of mast cells activity in the colon (black arrows indicate mast cells, red arrows indicate mast cell degranulation).
A: Normal control group; B: Model control group; C: Mox at 43 °C group; D: Mox at 46 °C group; E: EA at 1 mA group; F: EA at 3 mA group.
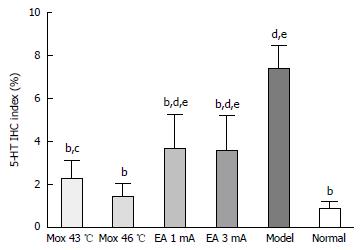
Figure 6 5-HT expression in the colon.
bP < 0.01, vs the MC group; cP < 0.05, dP < 0.01, vs the NC group; eP < 0.01, vs the Mox at 46 °C group.
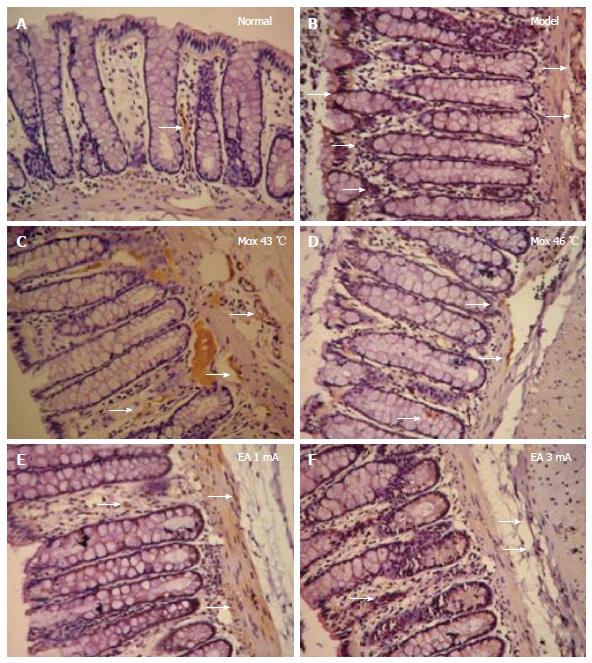
Figure 7 5-hydroxytryptamine expression in the colon (white arrows indicate positive expression of 5-hydroxytryptamine).
A: Normal control group; B: Model control group; C: Mox at 43 °C group; D: Mox at 46 °C group; E: EA at 1 mA group; F: EA at 3 mA group.
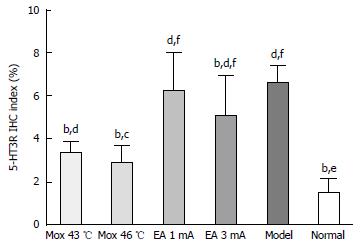
Figure 8 5-hydroxytryptamine 3 receptor expression in the colon.
bP < 0.01, vs the MC group; cP < 0.05, dP < 0.01, vs the NC group; eP < 0.05, fP < 0.01, vs the Mox at 46 °C group.
Figure 9 5-hydroxytryptamine 3 receptor expression in the colon (white arrows indicate positive expression of 5-hydroxytryptamine 3 receptor).
A: Normal control group; B: Model control group; C: Mox at 43 °C group; D: Mox at 46 °C group; E: EA at 1 mA group; F: EA at 3 mA group.
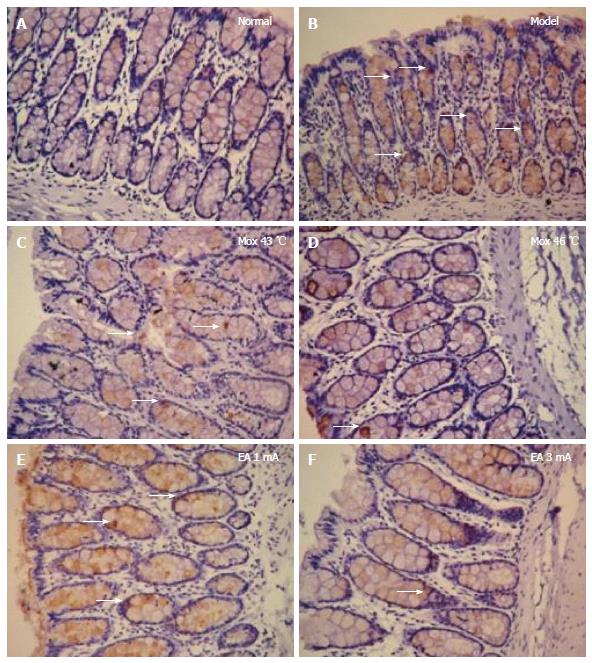
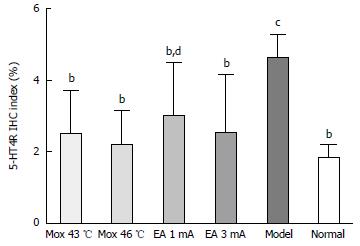
Figure 10 5-hydroxytryptamine 4 receptor expression in the colon.
bP < 0.01, vs the MC group; cP < 0.05, dP < 0.01, vs NC group.
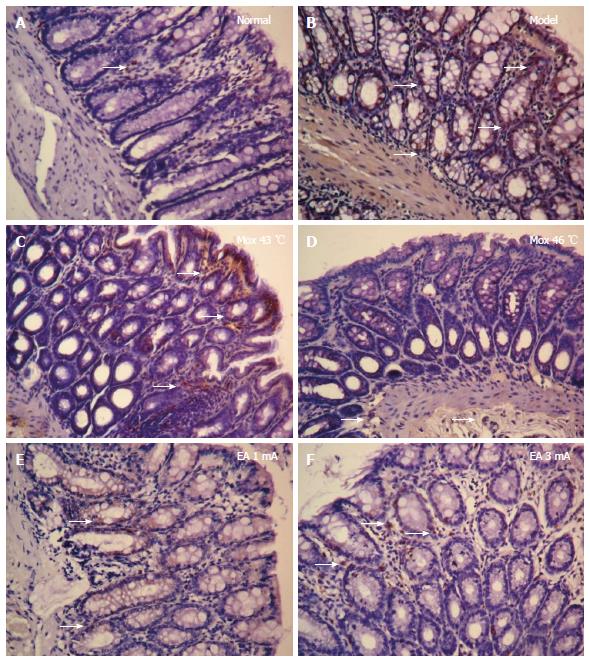
Figure 11 5-hydroxytryptamine 4 receptor expression in the colon (white arrows indicate positive expression of 5-hydroxytryptamine 4 receptor).
A: Normal control group; B: Model control group; C: Mox at 43 °C group; D: Mox at 46 °C group; E: EA at 1 mA group; F: EA at 3 mA group.
- Citation: Zhao JM, Li L, Chen L, Shi Y, Li YW, Shang HX, Wu LY, Weng ZJ, Bao CH, Wu HG. Comparison of the analgesic effects between electro-acupuncture and moxibustion with visceral hypersensitivity rats in irritable bowel syndrome. World J Gastroenterol 2017; 23(16): 2928-2939
- URL: https://www.wjgnet.com/1007-9327/full/v23/i16/2928.htm
- DOI: https://dx.doi.org/10.3748/wjg.v23.i16.2928


