Copyright
©The Author(s) 2017.
World J Gastroenterol. Apr 28, 2017; 23(16): 2832-2840
Published online Apr 28, 2017. doi: 10.3748/wjg.v23.i16.2832
Published online Apr 28, 2017. doi: 10.3748/wjg.v23.i16.2832
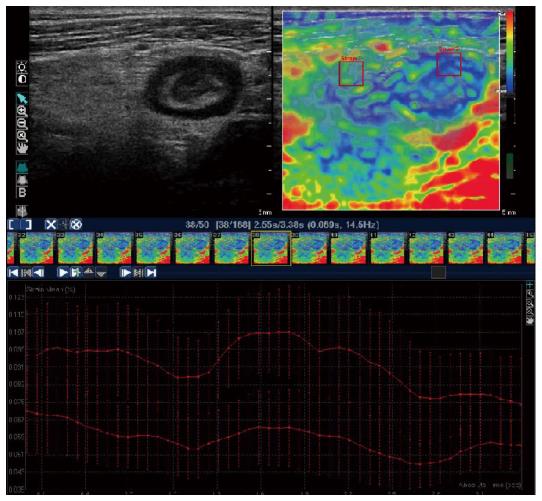
Figure 1 Upper left quadrant: Ultrasound image of the thickened terminal ileum of a Crohn’s disease patient, with a narrowed lumen and surrounding mesenteric tissue.
Upper right quadrant: Appearance of the same ileal segment with strain elastography. Regions of interest (ROIs) can be selected for the quantitative assessment of the strain ratio (see text). Lower quadrant: Strain values of ROI 1 (mesenteric tissue) and ROI 2 (ileal wall) plotted over time for the software to calculate the mean strain ratio (adapted from Fraquelli et al[49]).
- Citation: Branchi F, Caprioli F, Orlando S, Conte D, Fraquelli M. Non-invasive evaluation of intestinal disorders: The role of elastographic techniques. World J Gastroenterol 2017; 23(16): 2832-2840
- URL: https://www.wjgnet.com/1007-9327/full/v23/i16/2832.htm
- DOI: https://dx.doi.org/10.3748/wjg.v23.i16.2832


