Copyright
©The Author(s) 2017.
World J Gastroenterol. Apr 7, 2017; 23(13): 2318-2329
Published online Apr 7, 2017. doi: 10.3748/wjg.v23.i13.2318
Published online Apr 7, 2017. doi: 10.3748/wjg.v23.i13.2318
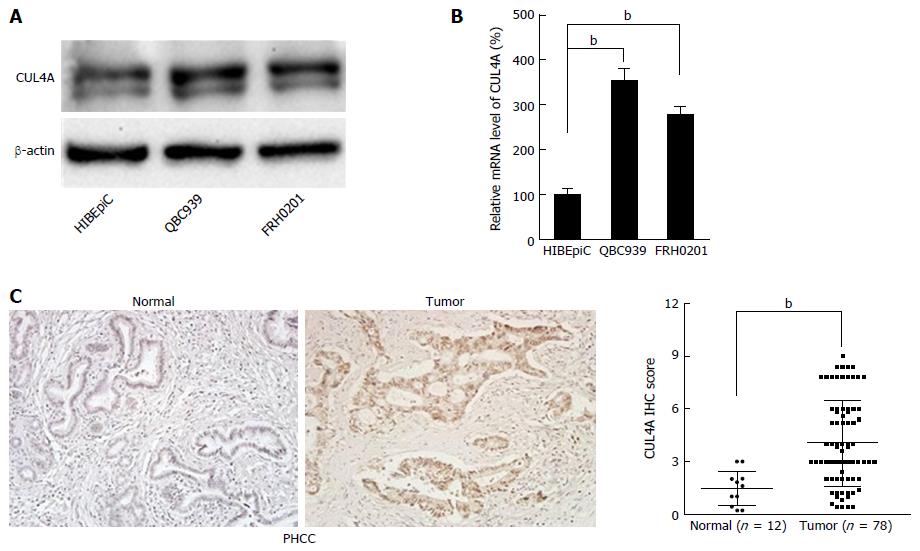
Figure 1 Cullin 4A is overexpressed in perihilar cholangiocarcinoma.
A: Expression of CUL4A protein was detected in normal biliary epithelial cells (HIBEpic) and PHCC cell lines by Western blot assays; B: Expression of CUL4A mRNA was detected in normal biliary epithelial cells (HIBEpiC) and PHCC cell lines by qRT-PCR assay; C: Representative images of CUL4A IHC staining in PHCC tumour tissues and normal adjacent tissues. Corresponding semiquantification of CUL4A expression is shown. Numbers in (B) indicate the fold changes of band densities based on at least three independent experiments. bP < 0.01 based on the Student’s t-test. Data are represented as mean ± SD. CUL4A: Cullin 4A; PHCC: Perihilar cholangiocarcinoma.
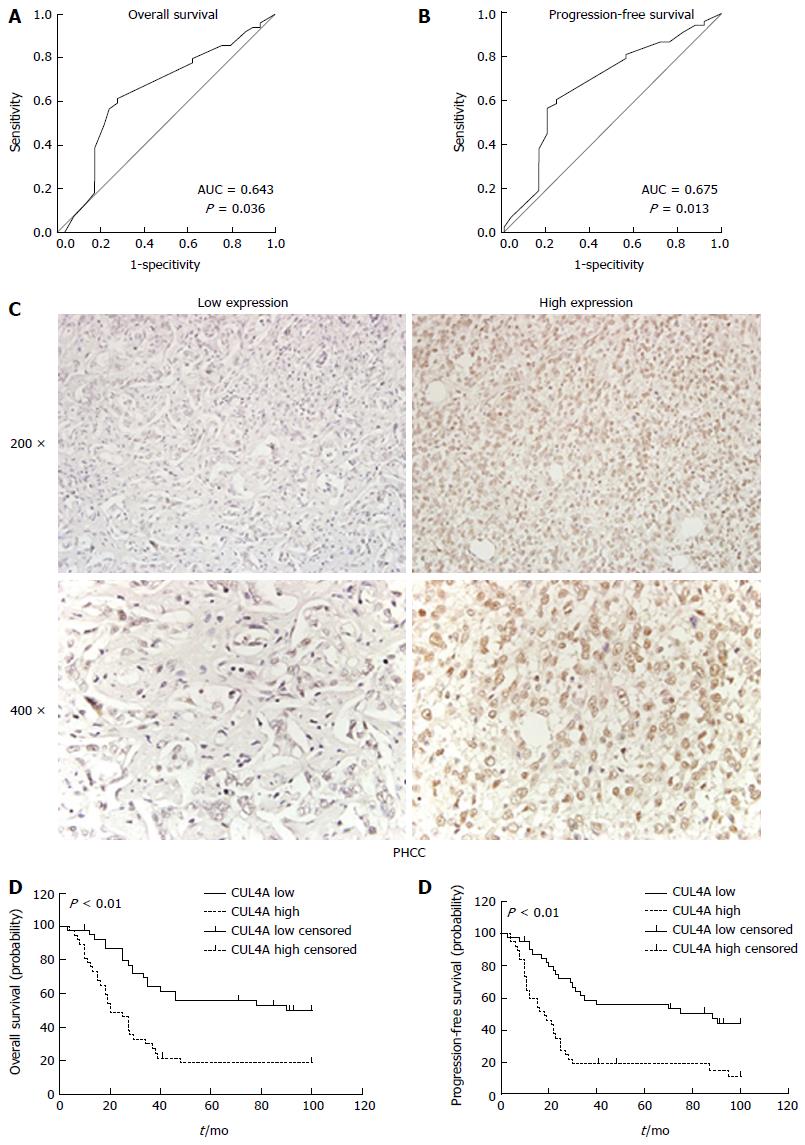
Figure 2 Cullin 4A correlates with a poor prognosis in perihilar cholangiocarcinoma.
A and B: The cut-off points of CUL4A expression for the overall survival (A) and progression-free survival (B) were analysed by the ROC curve analysis; C: Representative images of low and high CUL4A expression; D and E: Kaplan-Meier analysis and the log-rank test were adopted to investigate the overall survival (D) and progression-free survival (E) differences between the low and high CUL4A expression groups. P < 0.01 in D and E based on the log-rank test. CUL4A: Cullin 4A; PHCC: Perihilar cholangiocarcinoma.
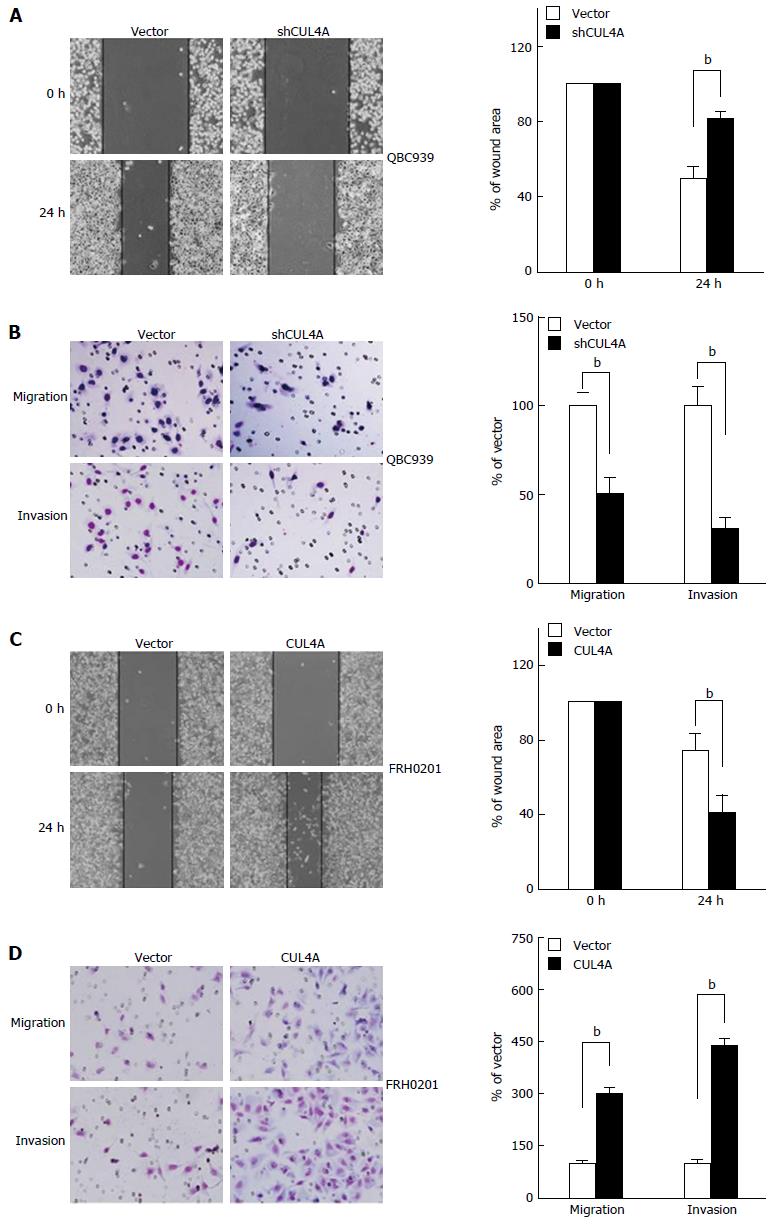
Figure 3 Cullin 4A promotes the migration and invasion of perihilar cholangiocarcinoma cell lines.
QBC939-shCUL4A and FRH0201-CUL4A cells or control cells were subjected to wound healing (A and C), Transwell migration (B and D, top), and Matrigel invasion (B and D, bottom) assays. A: Quantification was performed by measuring the uncovered areas compared with the controls; B: Quantification of migrated cells through the membrane and invaded cells through the Matrigel of each cell line is shown as proportions to their controls; C: Quantification was carried out by measuring the uncovered areas compared with the controls; D: Quantification of migrated cells through the membrane and invaded cells through Matrigel for each cell line is shown as proportions to their controls. bP < 0.01 based on the Student’s t-test. All results are from at least three independent experiments. Data are represented as mean ± SD. CUL4A: Cullin 4A.
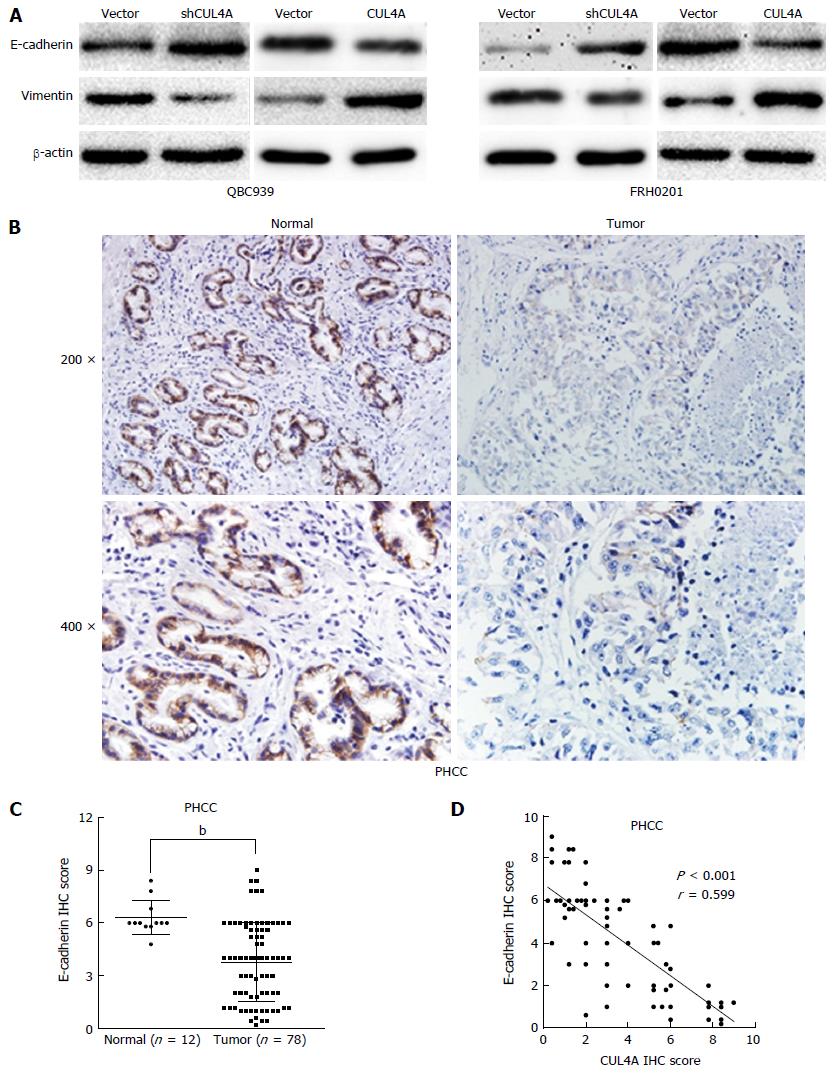
Figure 4 Cullin 4A induces the epithelial to mesenchymal transition in perihilar cholangiocarcinoma.
A: Expression levels of an epithelial marker (E-cadherin) and mesenchymal marker (vimentin) were analyzed by Western blot; B: Representative IHC images of E-cadherin expression in PHCC tissues and adjacent normal tissues; C: Statistical analysis of the semiquantification of E-cadherin expression in PHCC tissues and adjacent normal tissues; D: Linear regression analyses of IHC scores between CUL4A and E-cadherin expression in PHCC. bP < 0.01 based on the Student’s t-test. CUL4A: Cullin 4A; PHCC: Perihilar cholangiocarcinoma.
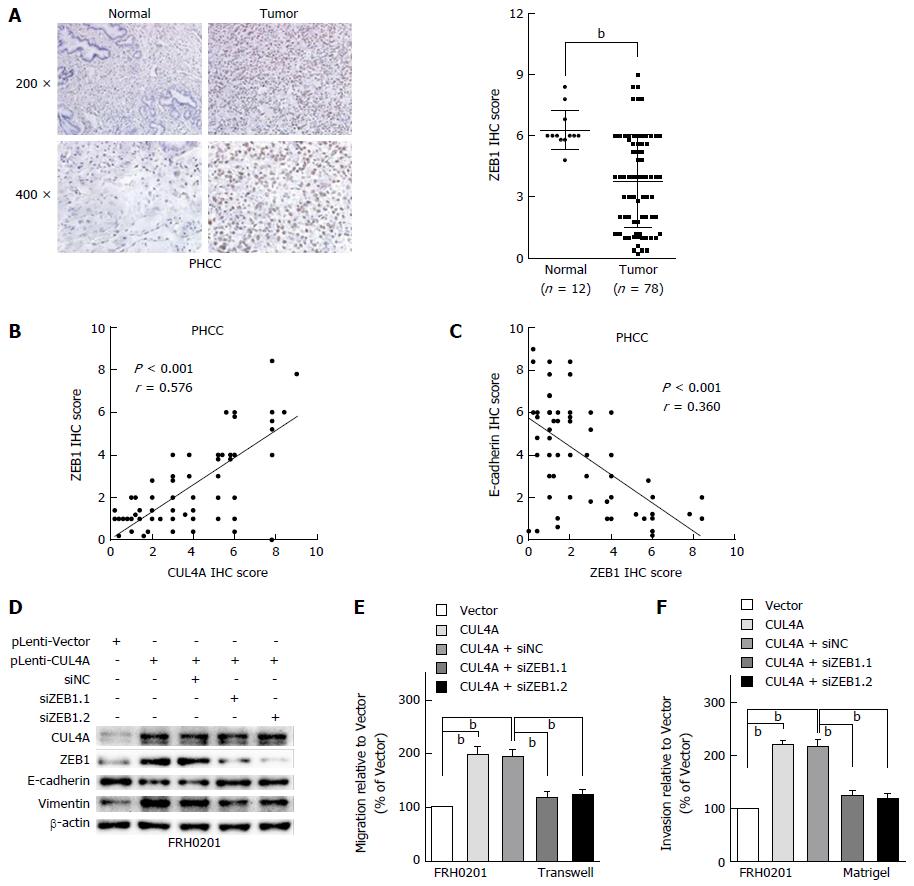
Figure 5 ZEB1 mediates the metastasis regulated by cullin 4A in perihilar cholangiocarcinoma.
A: Representative IHC images of ZEB1 expression in PHCC tissues and adjacent normal tissues. Corresponding semiquantification of ZEB1 expression is shown; B: Linear regression analyses of IHC scores between CUL4A and E-cadherin expression in PHCC; C: Linear regression analyses of IHC scores between CUL4A and ZEB1 expression in PHCC; D: Western blot assay was performed to investigate the E-cadherin and vimentin expression after ZEB1 interference in CUL4A overexpressing FRH0201 cells; E and F: The Transwell and Migration assays were performed to analyse the migration and invasion ability changes in CUL4A overexpressing FRH0201 cells with ZEB1 depletion. bP < 0.01 based on the Student’s t-test. All results are from at least three independent experiments. Data are represented as mean ± SD. CUL4A: Cullin 4A; PHCC: Perihilar cholangiocarcinoma.
- Citation: Zhang TJ, Xue D, Zhang CD, Zhang ZD, Liu QR, Wang JQ. Cullin 4A is associated with epithelial to mesenchymal transition and poor prognosis in perihilar cholangiocarcinoma. World J Gastroenterol 2017; 23(13): 2318-2329
- URL: https://www.wjgnet.com/1007-9327/full/v23/i13/2318.htm
- DOI: https://dx.doi.org/10.3748/wjg.v23.i13.2318


