Copyright
©The Author(s) 2017.
World J Gastroenterol. Mar 28, 2017; 23(12): 2149-2158
Published online Mar 28, 2017. doi: 10.3748/wjg.v23.i12.2149
Published online Mar 28, 2017. doi: 10.3748/wjg.v23.i12.2149
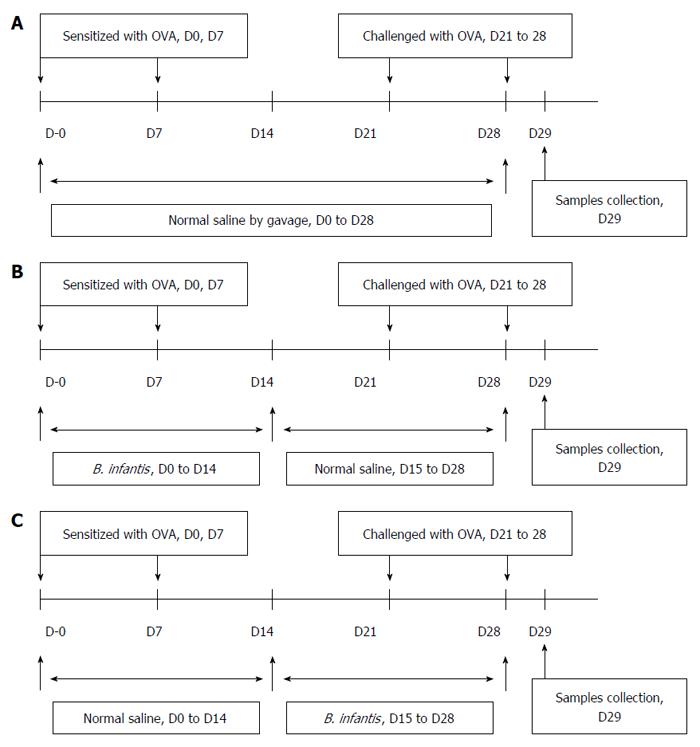
Figure 1 Protocols used for establishment of the mouse models.
A: Allergic asthma; B: Prevention; C: Pre-treatment of OVA-induced airway allergy with B. infantis CGMCC313-2.
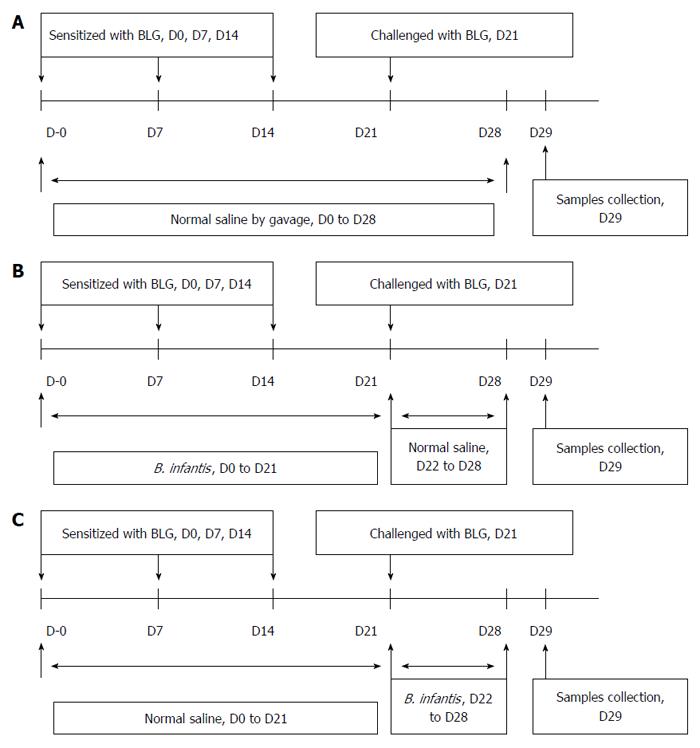
Figure 2 Protocols used for establishment of the mouse models.
A: Food allergy; B: Prevention; C: Pre-treatment of β-lactoglobulin-induced food allergies with B. infantis CGMCC313-2.
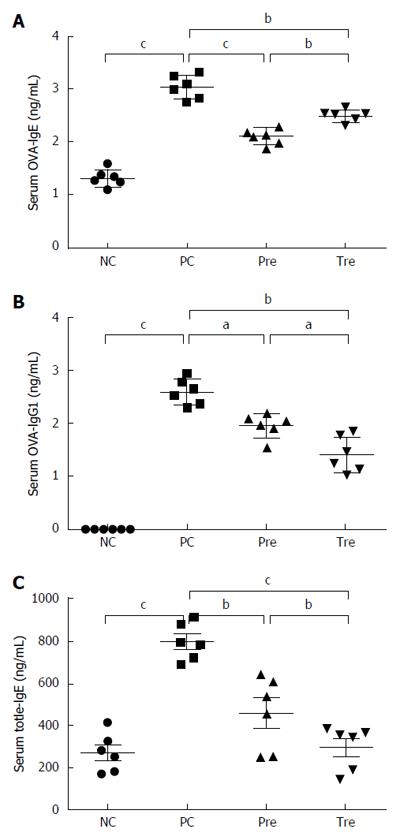
Figure 3 Effect of B.
infantis CGMCC313-2 on the reversal of IgE and IgG1 in ovalbumin-induced asthma and β-lactoglobulin-induced food allergy mouse models. A and B: There were significant increases in OVA-specific IgE and IgG1 expression in the positive control (PC; Group 2) group compared with the normal control (NC; Group 1) group in the allergic asthma mouse model. The prevention (pre; Group 3) and pre-treatment (tre; Group 4) groups following B. infantis CGMCC313-2 administration showed decreased expression; C: A significant increase in total IgE expression was seen in the positive control (PC; Group 2) group compared with the normal control (NC; Group 1) group in the BLG-induced food allergy mouse model. The prevention (pre; Group 3) and pre-treatment (tre; Group 4) groups following B. infantis CGMCC313-2 administration showed decreased expression. The statistical differences are represented as follows: aP < 0.05; bP < 0.01, and cP < 0.001.
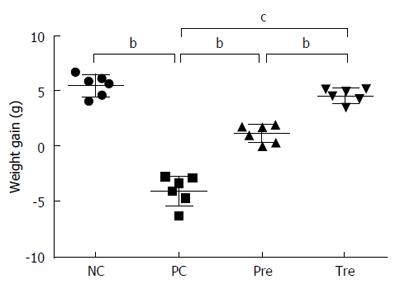
Figure 4 Effect of B.
infantis CGMCC313-2 on body weight in BLG-induced food allergy mice. Average body weight decreased significantly in the positive control (PC; Group 2) group compared with the normal control (NC; Group 1) group. The prevention (pre; Group 3) and pre-treatment (tre; Group 4) groups following B. infantis CGMCC313-2 administration showed an increase in body weight. The statistical differences are represented as follows: aP < 0.05; bP < 0.01, and cP < 0.001.
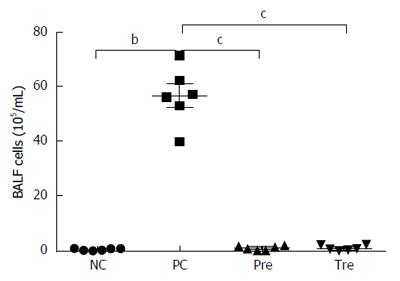
Figure 5 Effects of B.
infantis CGMCC313-2 on infiltrating cells in the lungs of ovalbumin-induced allergic asthma mice. Total cell number in BALF increased significantly in the positive control (PC; Group 2) group compared with the normal control (NC; Group 1) group. The prevention (pre; Group 3), and pre-treatment (tre; Group 4) groups following B. infantis CGMCC313-2 administration showed a decrease. The statistical differences are represented as: aP < 0.05; bP < 0.01, and cP < 0.001.
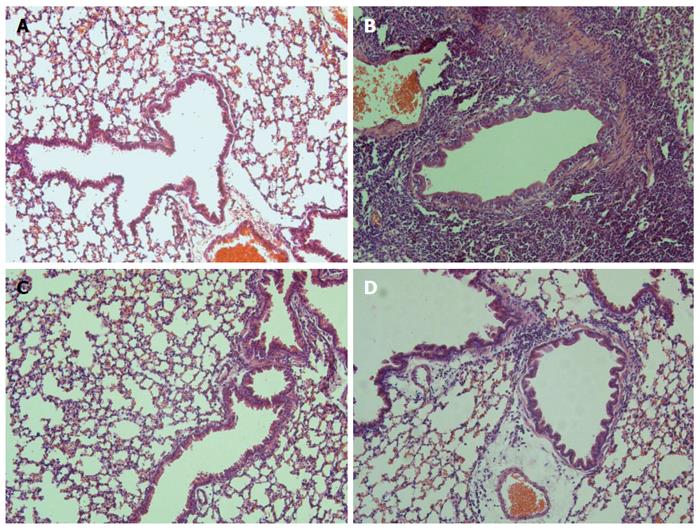
Figure 6 Effects of B.
infantis CGMCC313-2 on OVA-induced airway inflammation. Lung tissues were obtained from the (C) prevention group and (D) pre-treatment group treated with B. infantis CGMCC313-2, and from (A) the normal control group and (B) the ovalbumin sensitized/challenged group on Day 29. The tissues were stained and observed under × 200 magnification. The positive control group showed severe airway inflammation, while the groups treated with B. infantis CGMCC313-2 showed attenuation of airway inflammation.
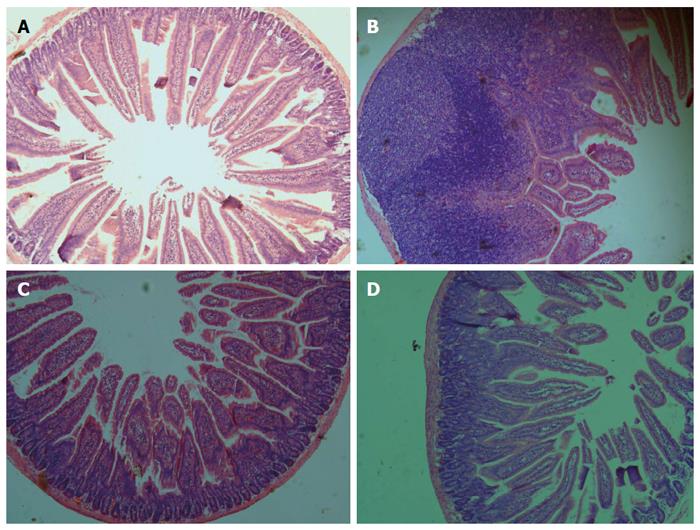
Figure 7 Effects of B.
infantis CGMCC313-2 on BLG-induced intestinal inflammation. Intestinal tissues were obtained from (A) the normal control group and (B) the BLG-sensitized/challenged group on Day 29, and from the (C) prevention group and (D) pre-treatment group which were treated with B. infantis CGMCC313-2. The tissues were stained and observed under 200 × magnification. The positive control group showed severe intestinal inflammation, while the groups treated with B. infantis CGMCC313-2 showed attenuated intestinal inflammation.
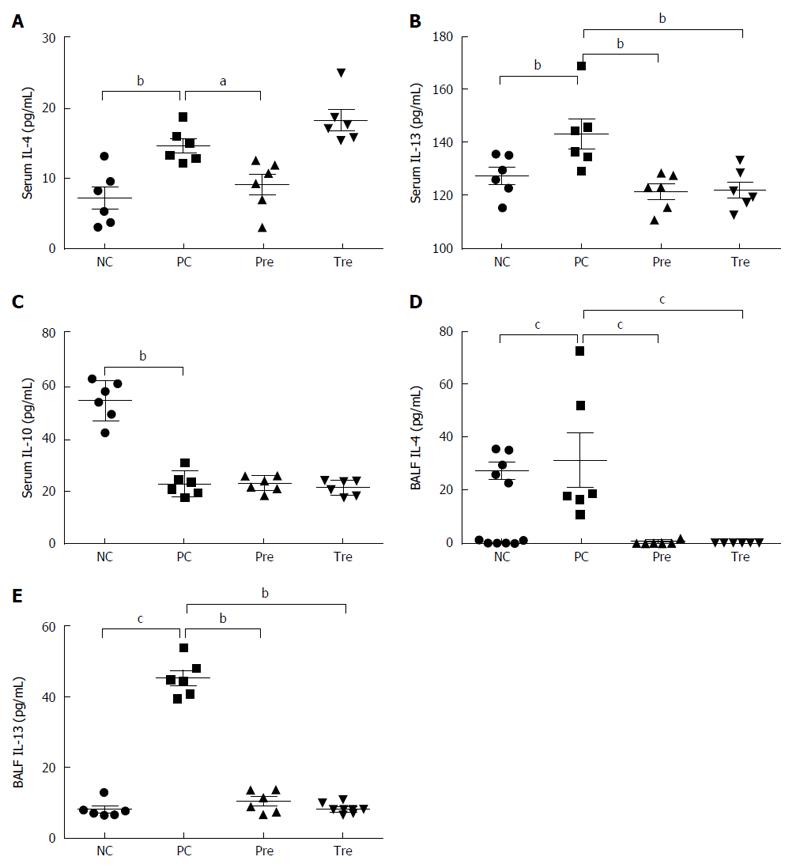
Figure 8 Effects of B.
infantis CGMCC313-2 on cytokines in serum and bronchoalveolar lavage fluid. IL-4, IL-10, and IL-13 in serum and BALF were determined in BLG-induced food allergy mice and OVA-induced allergic asthma mice, respectively. A: Serum IL-4 in the prevention (pre; Group 3) group; B: serum IL-13 in the prevention (pre; Group 3) and pre-treatment (tre; Group 4) groups were significantly decreased compared with the positive control (PC; Group 2) group; C: There was no significant difference in IL-10 between the positive control group (PC; Group 2), prevention group (pre; Group 3), and pre-treatment (tre; Group 4), which was significantly decreased when compared with the normal control (NC; Group 1) group; D: The concentrations of BALF IL-4 and (E) BALF IL-13 were significantly decreased in the prevention (pre; Group 3) group and the pre-treatment (tre; Group 4) group treated with B. infantis CGMCC313-2. The statistical differences are represented as follows: aP < 0.05; bP < 0.01, and cP < 0.001.
- Citation: Liu MY, Yang ZY, Dai WK, Huang JQ, Li YH, Zhang J, Qiu CZ, Wei C, Zhou Q, Sun X, Feng X, Li DF, Wang HP, Zheng YJ. Protective effect of Bifidobacterium infantis CGMCC313-2 on ovalbumin-induced airway asthma and β-lactoglobulin-induced intestinal food allergy mouse models. World J Gastroenterol 2017; 23(12): 2149-2158
- URL: https://www.wjgnet.com/1007-9327/full/v23/i12/2149.htm
- DOI: https://dx.doi.org/10.3748/wjg.v23.i12.2149


