Copyright
©The Author(s) 2017.
World J Gastroenterol. Mar 21, 2017; 23(11): 2060-2067
Published online Mar 21, 2017. doi: 10.3748/wjg.v23.i11.2060
Published online Mar 21, 2017. doi: 10.3748/wjg.v23.i11.2060
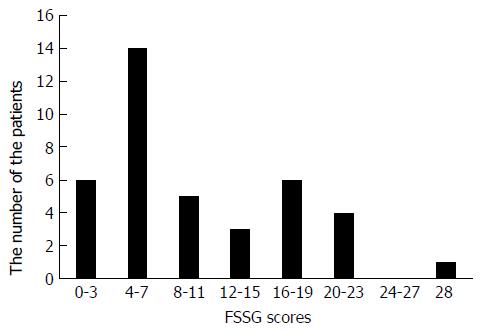
Figure 1 Distribution of frequency scale for symptoms of gastroesophageal reflux disease scores in the present study.
FSSG: Frequency scale for symptoms of gastroesophageal reflux disease.
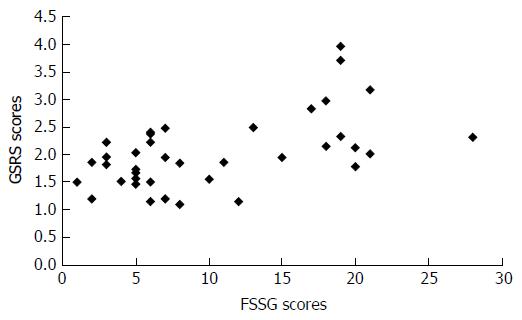
Figure 2 Correlation between the frequency scale for symptoms of gastroesophageal reflux disease and gastrointestinal symptom rating scores.
FSSG: Frequency scale for symptoms of gastroesophageal reflux disease; GSRS: Gastrointestinal Symptom Rating Scale.
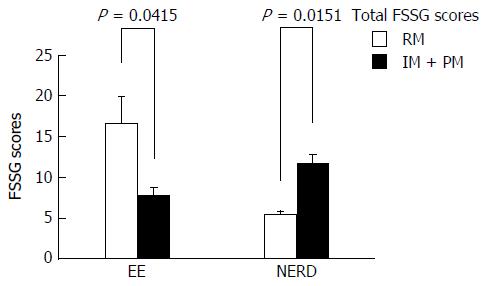
Figure 3 Correlation between the cytochrome P450 2C19 genotype and the total frequency scale for symptoms of gastroesophageal reflux disease score in the erosive esophagitis and non-erosive reflux disease patients.
FSSG: Frequency scale for symptoms of gastroesophageal reflux disease; EE: Erosive esophagitis; NERD: Non-erosive reflux disease; RM: Rapid metabolizer; IM: Intermediate metabolizer; PM: Poor metabolizer.
- Citation: Kawara F, Fujita T, Morita Y, Uda A, Masuda A, Saito M, Ooi M, Ishida T, Kondo Y, Yoshida S, Okuno T, Yano Y, Yoshida M, Kutsumi H, Hayakumo T, Yamashita K, Hirano T, Hirai M, Azuma T. Factors associated with residual gastroesophageal reflux disease symptoms in patients receiving proton pump inhibitor maintenance therapy. World J Gastroenterol 2017; 23(11): 2060-2067
- URL: https://www.wjgnet.com/1007-9327/full/v23/i11/2060.htm
- DOI: https://dx.doi.org/10.3748/wjg.v23.i11.2060


