Copyright
©The Author(s) 2017.
World J Gastroenterol. Mar 14, 2017; 23(10): 1881-1890
Published online Mar 14, 2017. doi: 10.3748/wjg.v23.i10.1881
Published online Mar 14, 2017. doi: 10.3748/wjg.v23.i10.1881
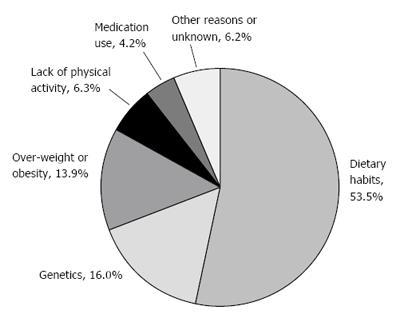
Figure 1 Patients’ perceptions regarding the main reasons for non-alcoholic fatty liver disease.
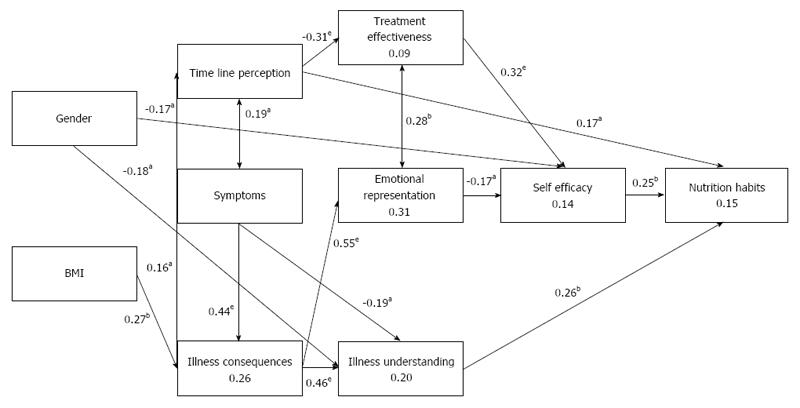
Figure 2 Path model for the study variables predicting nutritional habits.
Values attached to the arrows represent regression standardized coefficients (β values), with significance levels in asterisks. Values within the rectangles represent the explained variance by the variable (R2). NFI = 0.870, NNFI = 0.985, CFI = 0.992, RMSEA = 0.018, χ2(29) = 30.413, P = 0.394. aP < 0.05, bP < 0.01, eP < 0.001 NFI: Normal fit index; NNFI: Non-normal fit index; CFI: Comparative fit index; RMSEA: Root mean standard error of approximation.
- Citation: Zelber-Sagi S, Bord S, Dror-Lavi G, Smith ML, Towne Jr SD, Buch A, Webb M, Yeshua H, Nimer A, Shibolet O. Role of illness perception and self-efficacy in lifestyle modification among non-alcoholic fatty liver disease patients. World J Gastroenterol 2017; 23(10): 1881-1890
- URL: https://www.wjgnet.com/1007-9327/full/v23/i10/1881.htm
- DOI: https://dx.doi.org/10.3748/wjg.v23.i10.1881


