Copyright
©The Author(s) 2017.
World J Gastroenterol. Mar 14, 2017; 23(10): 1836-1842
Published online Mar 14, 2017. doi: 10.3748/wjg.v23.i10.1836
Published online Mar 14, 2017. doi: 10.3748/wjg.v23.i10.1836
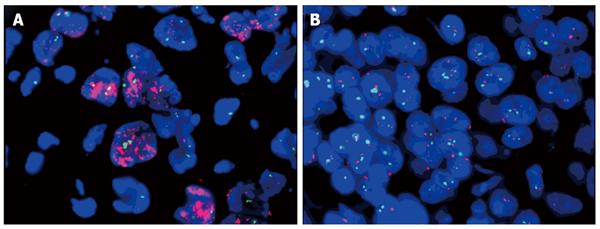
Figure 1 Representative gene amplification results of fluorescence in situ hybridization.
A: Cases with HER2:CEP17 signal ratio > 2.0; B: Cases with HER2: CEP17 signal ratio < 2.0.
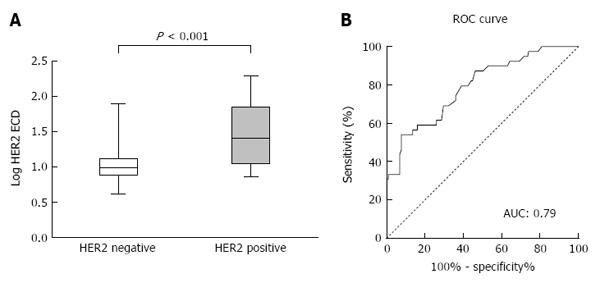
Figure 2 Serum HER2 ECD concentrations in patients with tissue HER2-positive and HER2-negative gastric cancer (A) and receiver operating characteristic curve plot of serum HER2 ECD for tissue HER2 status (B).
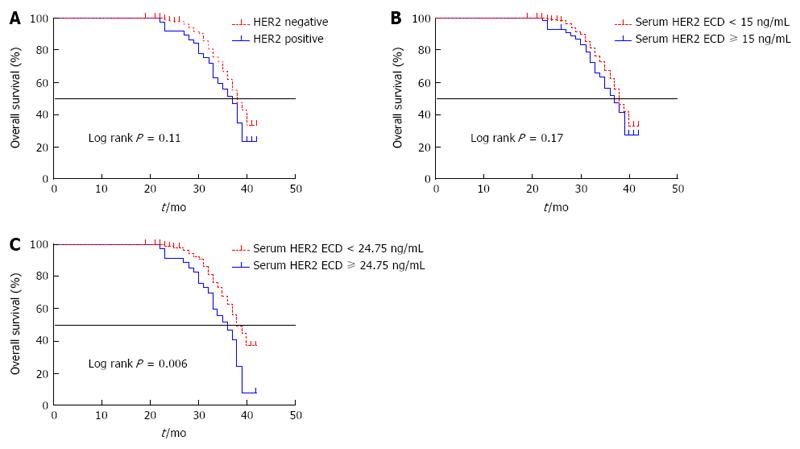
Figure 3 Kaplan-Meier curves for overall survival.
A: Overall survival in patients with HER2-positive and HER2-negative gastric cancer; B: Serum HER2 extracellular domain (ECD) level < 15 ng/mL and serum HER2 ECD ≥ 15.0 ng/mL; and C: Serum HER2 ECD < 24.75 ng/mL and serum HER2 ECD ≥ 24.75 ng/mL.
- Citation: Shi HZ, Wang YN, Huang XH, Zhang KC, Xi HQ, Cui JX, Liu GX, Liang WT, Wei B, Chen L. Serum HER2 as a predictive biomarker for tissue HER2 status and prognosis in patients with gastric cancer. World J Gastroenterol 2017; 23(10): 1836-1842
- URL: https://www.wjgnet.com/1007-9327/full/v23/i10/1836.htm
- DOI: https://dx.doi.org/10.3748/wjg.v23.i10.1836


