Copyright
©The Author(s) 2017.
World J Gastroenterol. Jan 7, 2017; 23(1): 87-92
Published online Jan 7, 2017. doi: 10.3748/wjg.v23.i1.87
Published online Jan 7, 2017. doi: 10.3748/wjg.v23.i1.87
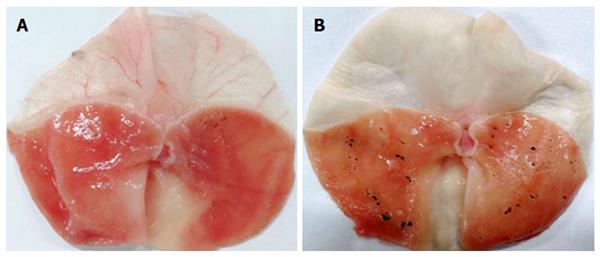
Figure 1 Representative of the degree of gastric mucosal damage induced by restraint water-immersion stress.
A: Representative of the degree of gastric mucosal damage in the control group; B: Representative of the degree of gastric mucosal damage in the physiological saline group; C: Representative of the degree of gastric mucosal damage in the NaHS group.
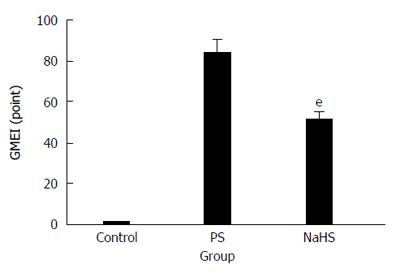
Figure 2 Gastric mucosal erosion index of the control, physiological saline and NaHS groups.
eP < 0.001. GMEI: Gastric mucosal erosion index; PS: Physiological saline.
Figure 3 Representative of the degree of gastric mucosal damage in the NaHS group (A) and the glibenclamide + NaHS group (B).
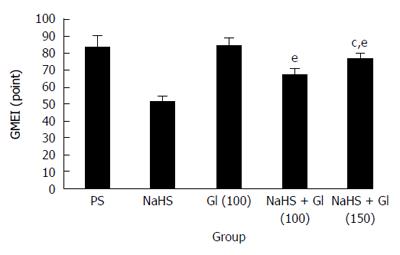
Figure 4 Gastric mucosal erosion index in the NaHS group and the glibenclamide + NaHS group.
Gl + NaHS group vs the NaHS group, eP < 0.001; Gl (100 μmol/kg body weight) plus NaHS group vs the Gl (150 μmol/kg body weight) + NaHS group, cP < 0.05. GMEI: Gastric mucosal erosion index; PS: Physiological saline; GI: Glibenclamide.
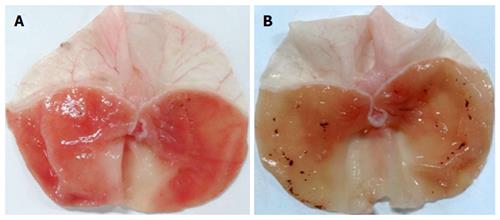
Figure 5 Representative of the degree of gastric mucosal damage in the NaHS group (A) and pyrrolidine dithiocarbamate + NaHS group (B).
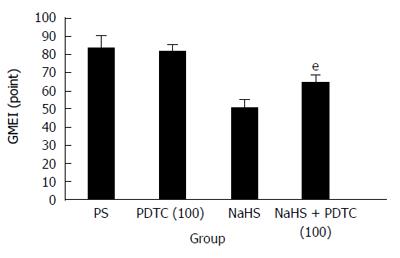
Figure 6 Gastric mucosal erosion index in the NaHS group and PDTC + NaHS group.
eP < 0.001. GMEI: Gastric mucosal erosion index; PDTC: Pyrrolidine dithiocarbamate; PS: Physiological saline.
- Citation: Sun HZ, Zheng S, Lu K, Hou FT, Bi JX, Liu XL, Wang SS. Hydrogen sulfide attenuates gastric mucosal injury induced by restraint water-immersion stress via activation of KATP channel and NF-κB dependent pathway. World J Gastroenterol 2017; 23(1): 87-92
- URL: https://www.wjgnet.com/1007-9327/full/v23/i1/87.htm
- DOI: https://dx.doi.org/10.3748/wjg.v23.i1.87


