Copyright
©The Author(s) 2016.
World J Gastroenterol. Mar 7, 2016; 22(9): 2799-2810
Published online Mar 7, 2016. doi: 10.3748/wjg.v22.i9.2799
Published online Mar 7, 2016. doi: 10.3748/wjg.v22.i9.2799
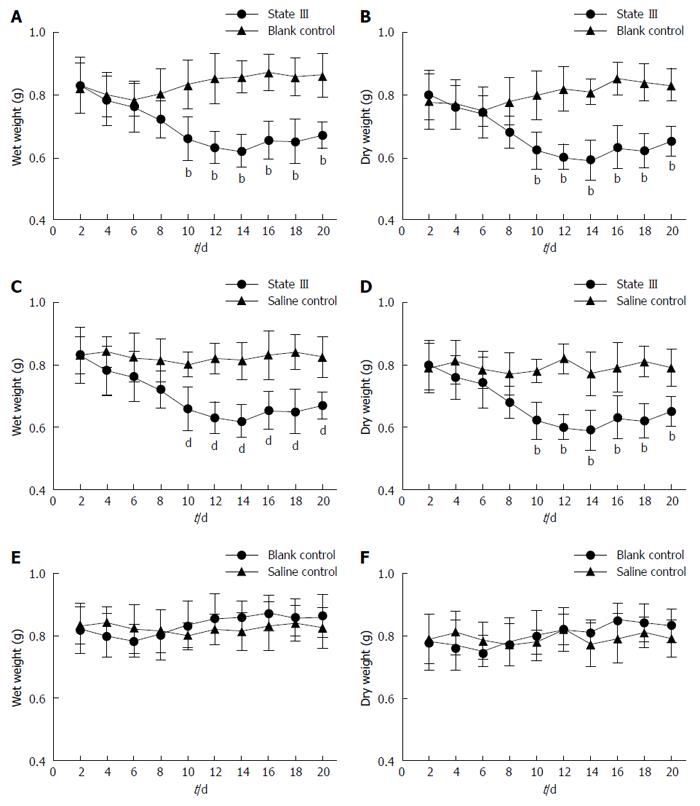
Figure 1 Changes in the wet weight and dry weight of stools in all groups.
A, B: State III mice in ice-cold group compared with blank control group animals; C, D: State III mice in ice-cold group compared with saline control group; E, F: Stool weight changes in blank control compared with saline control group animals. bP < 0.01 vs blank control group; dP < 0.01 vs saline control group (n = 4 for each group).
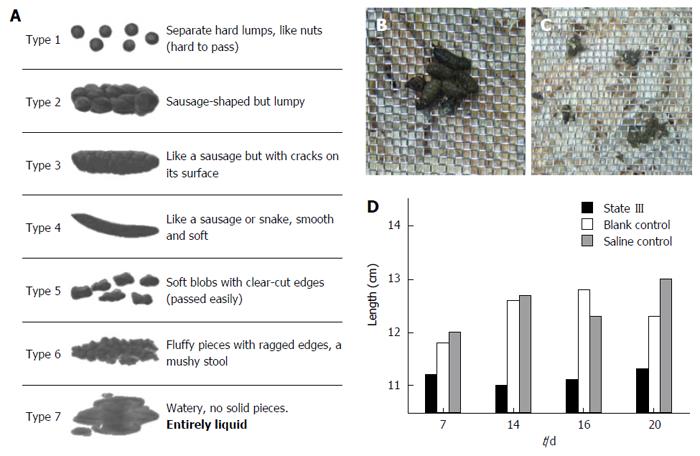
Figure 2 Changes in stool forms.
A: Bristol Stool Form Scale; B: Stools’ water content increases and stick together similar to Bristol scale type 5 or 6 of State I mice; C: Some stools adhere to the wire netting just like type 6 or 7, indicative of mild diarrhea; D: Comparison of total length estimated for 25 stool pellets (LS25).
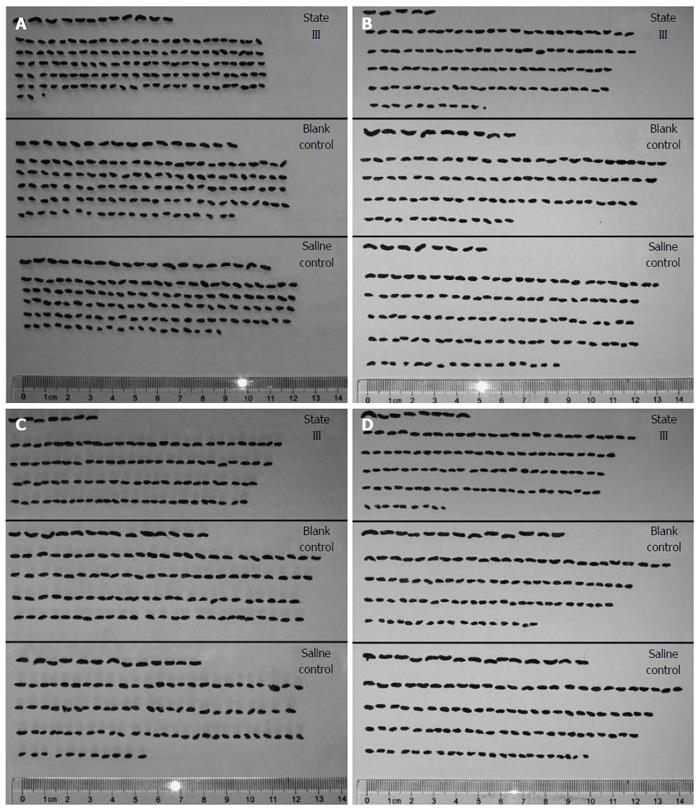
Figure 3 Image of stools from different groups.
In the first row in each group, stools were similar to type 3 or 4. From the second row, stools sequentially arranged in the same number (n = 25) in a row. A: at 7 d; B: at 14 d; C: at d 16; D: at 20 d.
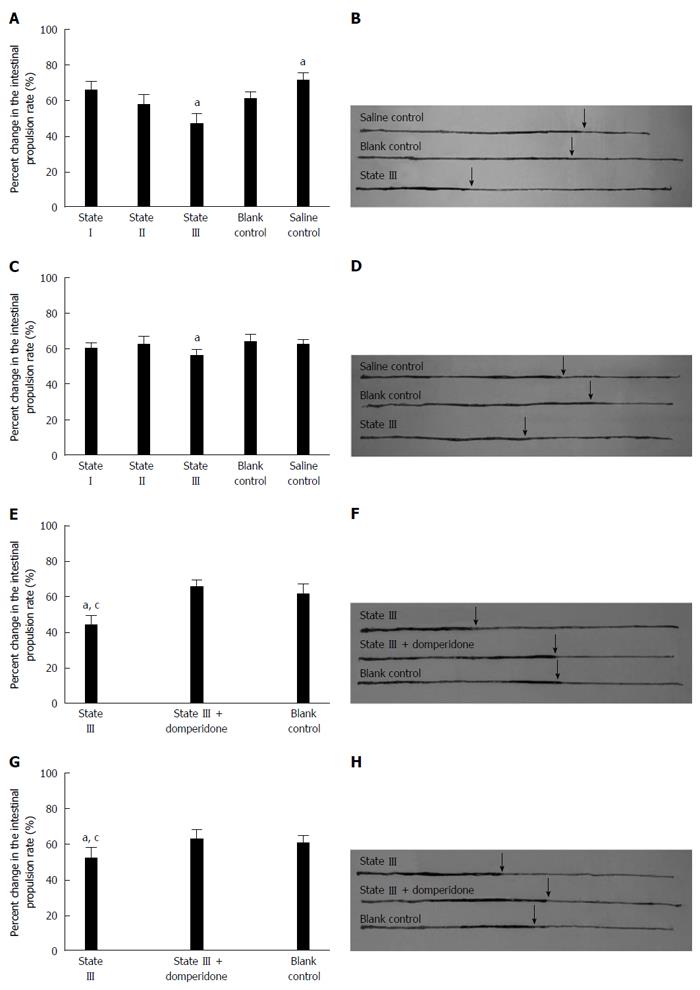
Figure 4 Measurement of carbon propulsion rate.
A, B: All groups were used in the intestinal propulsion experiment and the distances by which black carbon was propelled, significantly decreased in state III mice compared to blank and saline control group at 15 d; C, D: measurement in all groups and the distance comparison at 20 d; E, F: In state III mice using domperidone suspensions for pretreatment, the carbon propulsion rates increased compared to those in state III mice at 15 d; G, H: measurement at 20 d (n = 4 for each group), aP < 0.05 vs blank control group; cP < 0.05 vs state III treated with domperidone.
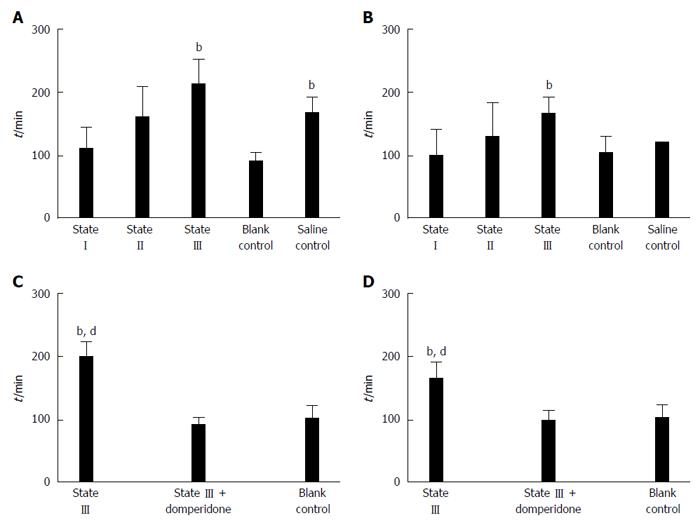
Figure 5 Measurement of time required for defecation of the first indicator-containing stool pellet.
A: All groups were measured at 15 d; B: All groups were measured at 20 d; C: State III compared to those treated with domperidone and blank control group at d15; D at 20 d (n = 5 for each group), bP < 0.01 vs blank control group; dP < 0.01 vs state III treated with domperidone.
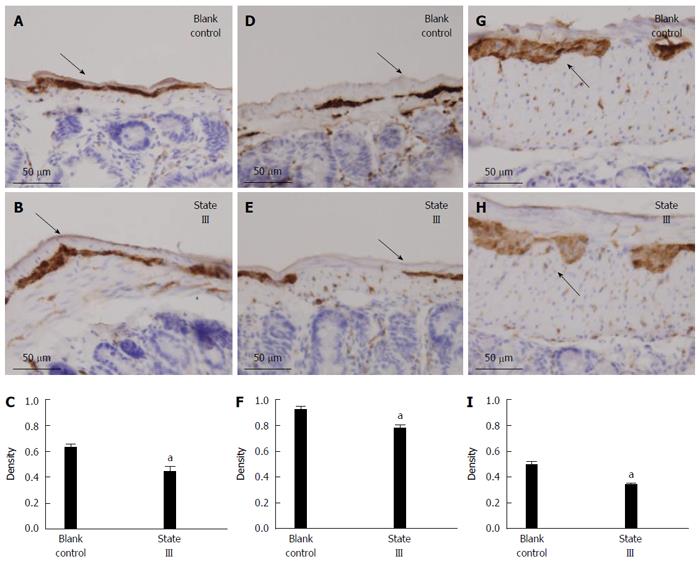
Figure 6 Effects on total neurons-PGP9.
5 protein expression in immunohistochemical staining. Tissue with brown granular deposits were positive reaction (as arrows indicated; -: 50 μm, magnification × 400). A, B: In jejunum; D, E: In ileum; G, H: In proximal colon; C, F, I: Comparison of the mean density of PGP9.5-positive expression between two groups. aP < 0.05 (n = 5 for each group).
- Citation: Liang C, Wang KY, Yu Z, Xu B. Development of a novel mouse constipation model. World J Gastroenterol 2016; 22(9): 2799-2810
- URL: https://www.wjgnet.com/1007-9327/full/v22/i9/2799.htm
- DOI: https://dx.doi.org/10.3748/wjg.v22.i9.2799


