Copyright
©The Author(s) 2016.
World J Gastroenterol. Mar 7, 2016; 22(9): 2789-2798
Published online Mar 7, 2016. doi: 10.3748/wjg.v22.i9.2789
Published online Mar 7, 2016. doi: 10.3748/wjg.v22.i9.2789
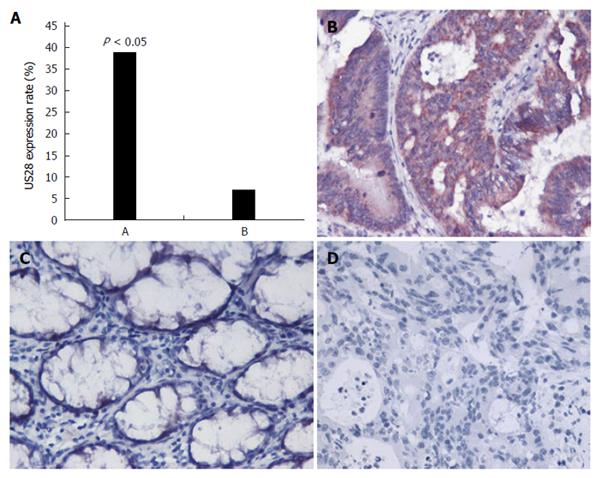
Figure 1 US28 protein expression in colorectal cancer and adjacent noncancerous tissues.
A: US28 protein expression in clorectal cancer (CRC) was significantly higher than that in adjacent noncancerous tissues; B: US28 protein was highly expressed or was diffusely positive in the cytoplasm and membranes of CRC tissues; C: Negative US28 protein expression was observed in most adjacent noncancerous tissues; D: Negative US28 protein expression was observed in all HCMV-negative colorectal carcinoma, magnification × 400.
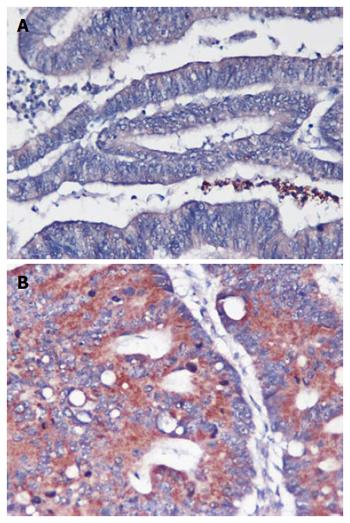
Figure 2 US28 protein expression in colorectal cancer tissues.
A: US28 protein expression was negative or low in highly differentiated colorectal cancer (CRC) tissues; B: US28 protein expression was diffuse and strong in poorly differentiated CRC tissues, magnification × 400.
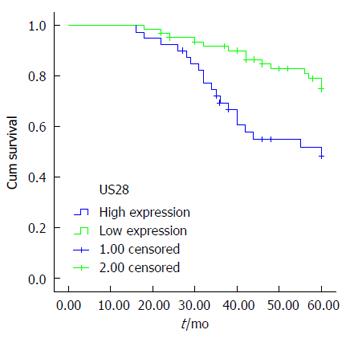
Figure 3 Kaplan-Meier survival analysis according to the US28 status (n = 103).
The Y-axis indicates the percentage of patients, and the X-axis depicts their survival in months. The green line represents patients with low US28 expression, who exhibited a trend of better survival, compared to patients with high US28 expression (indicated by the blue line) (P = 0.003). The mean overall survival (OS) time was 55.5 mo for the low US28 expression group and 47.4 mo for the high US28 expression group.
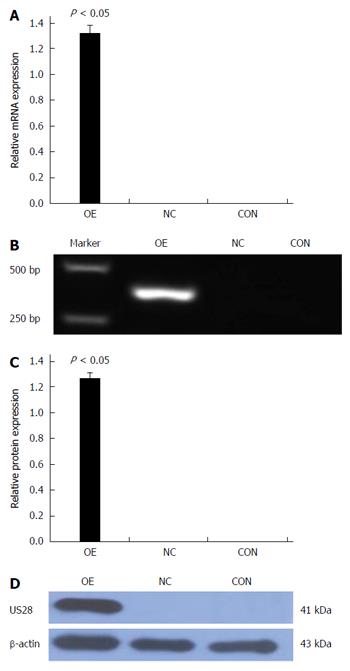
Figure 4 US28 expression in LOVO cells.
A, B: US28 mRNA expression was positive after transfection; the NC and CON groups were negative; C, D: US28 protein expression was positive after transfection; the NC and CON groups were negative. CON: Nontransfected control group; NC: Negative control group; OE: Transfection group.
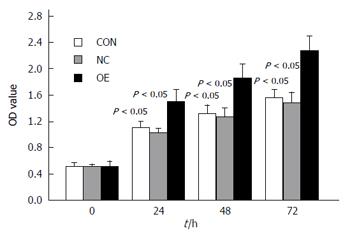
Figure 5 CCK-8 cell proliferation assays indicate that US28 gene transfection significantly enhanced proliferation.
CON: Nontransfected control group; NC: Negative control group; OE: Transfection group.
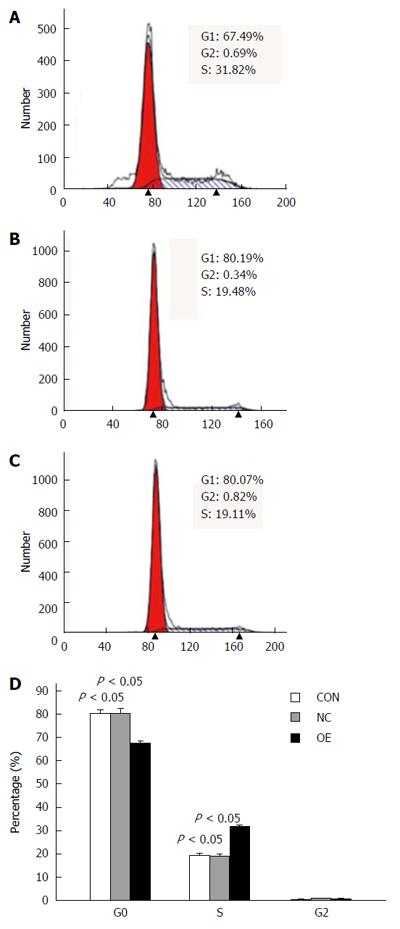
Figure 6 Cell cycle analysis by flow cytometry.
More LOVO cells transiently transfected with pCMV6-entry-US28 were in S phase (A) compared to the CON (B) and NC (C) groups. CON: Nontransfected control group; NC: Negative control group; OE: Transfection group.
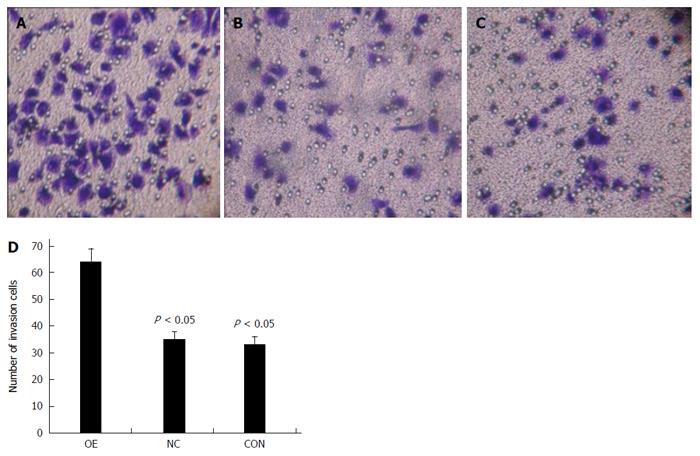
Figure 7 Effects of US28 on the invasion capacity of LOVO cells.
The OE group (A) shows more cells crossing the membrane compared with the CON (B) and NC (C) groups; The membrane-crossing cells were counted in five high-power fields of each chamber (D). The results are reported as the mean ± SD. Representative photomicrographs of the transwell results were obtained under × 200 magnification. Scale bars: 200 μm. CON: Nontransfected control group; NC: Negative control group; OE: Transfection group.
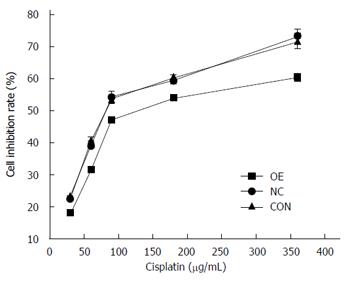
Figure 8 US28 expression caused the LOVO cells to become more resistant to cisplatin-induced cell death.
OE, NC and CON group cells were treated with different concentrations of cisplatin for 48 h, and relative drug resistance was analyzed by comparison with IC50 values. CON: Nontransfected control group; NC: Negative control group; OE: Transfection group.
- Citation: Cai ZZ, Xu JG, Zhou YH, Zheng JH, Lin KZ, Zheng SZ, Ye MS, He Y, Liu CB, Xue ZX. Human cytomegalovirus-encoded US28 may act as a tumor promoter in colorectal cancer. World J Gastroenterol 2016; 22(9): 2789-2798
- URL: https://www.wjgnet.com/1007-9327/full/v22/i9/2789.htm
- DOI: https://dx.doi.org/10.3748/wjg.v22.i9.2789


