Copyright
©The Author(s) 2016.
World J Gastroenterol. Mar 7, 2016; 22(9): 2771-2778
Published online Mar 7, 2016. doi: 10.3748/wjg.v22.i9.2771
Published online Mar 7, 2016. doi: 10.3748/wjg.v22.i9.2771
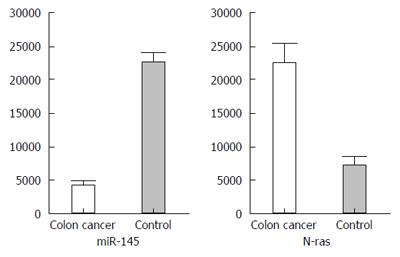
Figure 1 Expression of miR-145 and N-ras in colon cancer and normal colonic tissues.
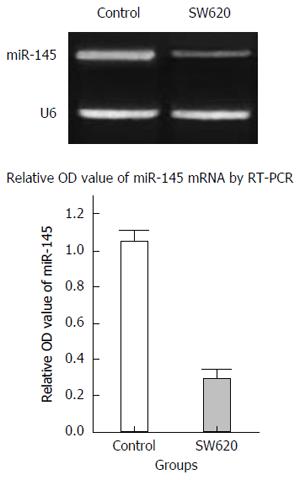
Figure 2 miR-145 expression in SW620 colon cancer cells and normal colonic epithelial cells.
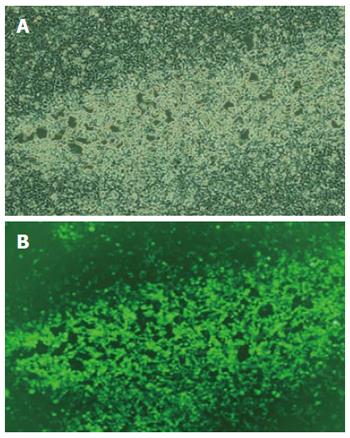
Figure 3 HEK239T cells under regular (A) and fluorescence (B) microscopy (magnification × 40) at 72 h after transfection with lentiviral vector.
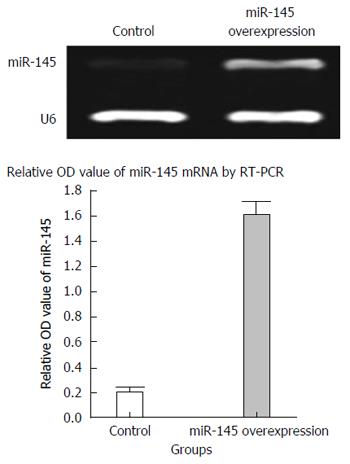
Figure 4 Reverse transcriptase polymerase chain reaction analysis of mature miR-145 expression in two groups of cells.
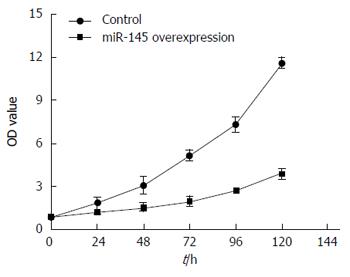
Figure 5 Growth curves of SW620 cells at indicated time points after transduction with lentiviral vectors.
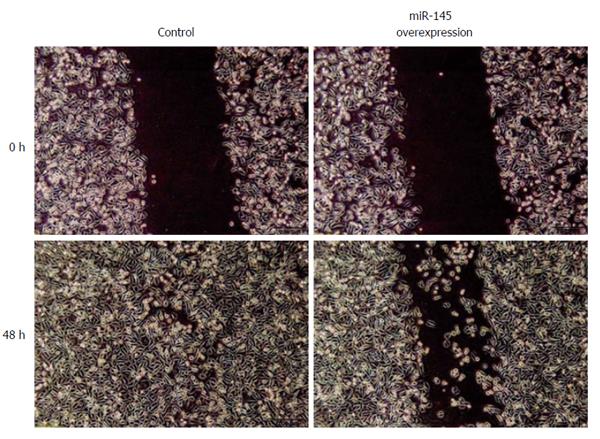
Figure 6 Effect of miR-145 on SW620 cell migration (magnification × 100).
MI = 100% (g0-gt)/g0; g0 represents the width of the open area immediately after scratching the monolayer (0 h); gt represents the width of the open area at t h post scratching the monolayer.
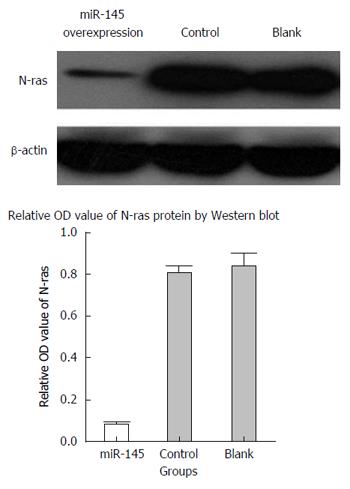
Figure 7 Effects of miR-145 on N-ras protein expression.
- Citation: Li C, Xu N, Li YQ, Wang Y, Zhu ZT. Inhibition of SW620 human colon cancer cells by upregulating miRNA-145. World J Gastroenterol 2016; 22(9): 2771-2778
- URL: https://www.wjgnet.com/1007-9327/full/v22/i9/2771.htm
- DOI: https://dx.doi.org/10.3748/wjg.v22.i9.2771


