Copyright
©The Author(s) 2016.
World J Gastroenterol. Feb 28, 2016; 22(8): 2503-2511
Published online Feb 28, 2016. doi: 10.3748/wjg.v22.i8.2503
Published online Feb 28, 2016. doi: 10.3748/wjg.v22.i8.2503
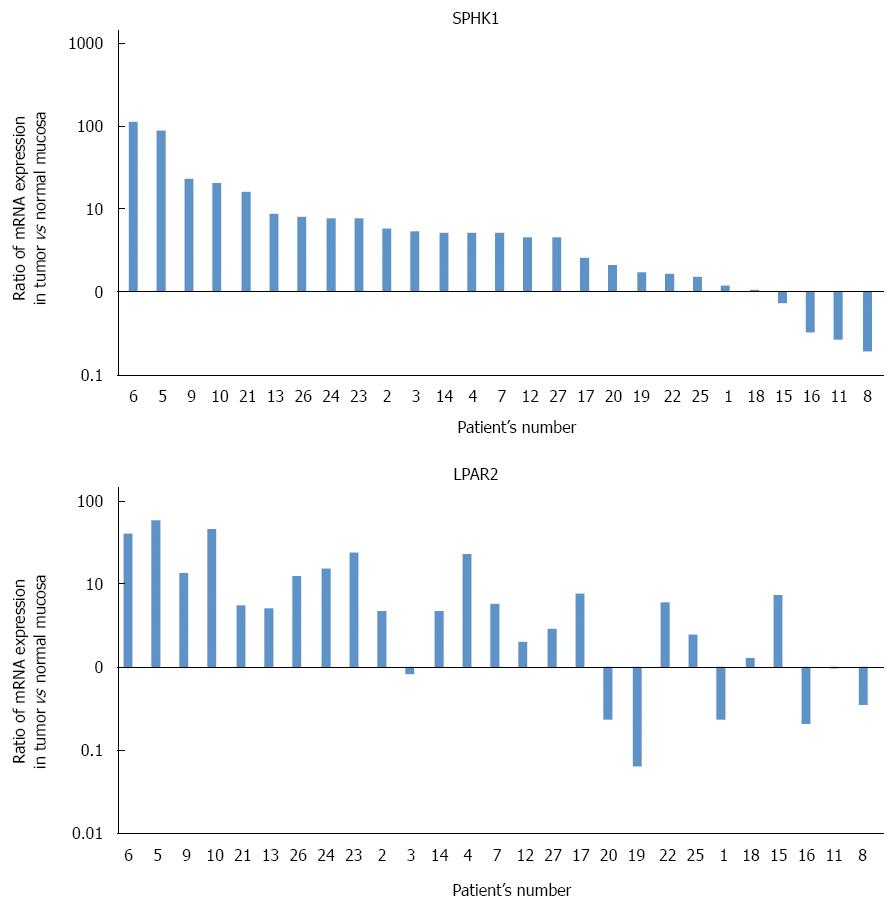
Figure 1 Ratios of SphK1 mRNA (A) and LPAR2 mRNA (B) in cancer tissue to those in normal tissue.
Both normalized to β-actin mRNA, as measured by real-time reverse-transcription polymerase chain reaction. In two-thirds of the samples, expression of SphK1 mRNA in cancer tissue was more than two-fold that of normal tissue. Colorectal cancer tissue in 20 of 27 patients expressed a higher level of LPAR2 mRNA than in normal tissue.
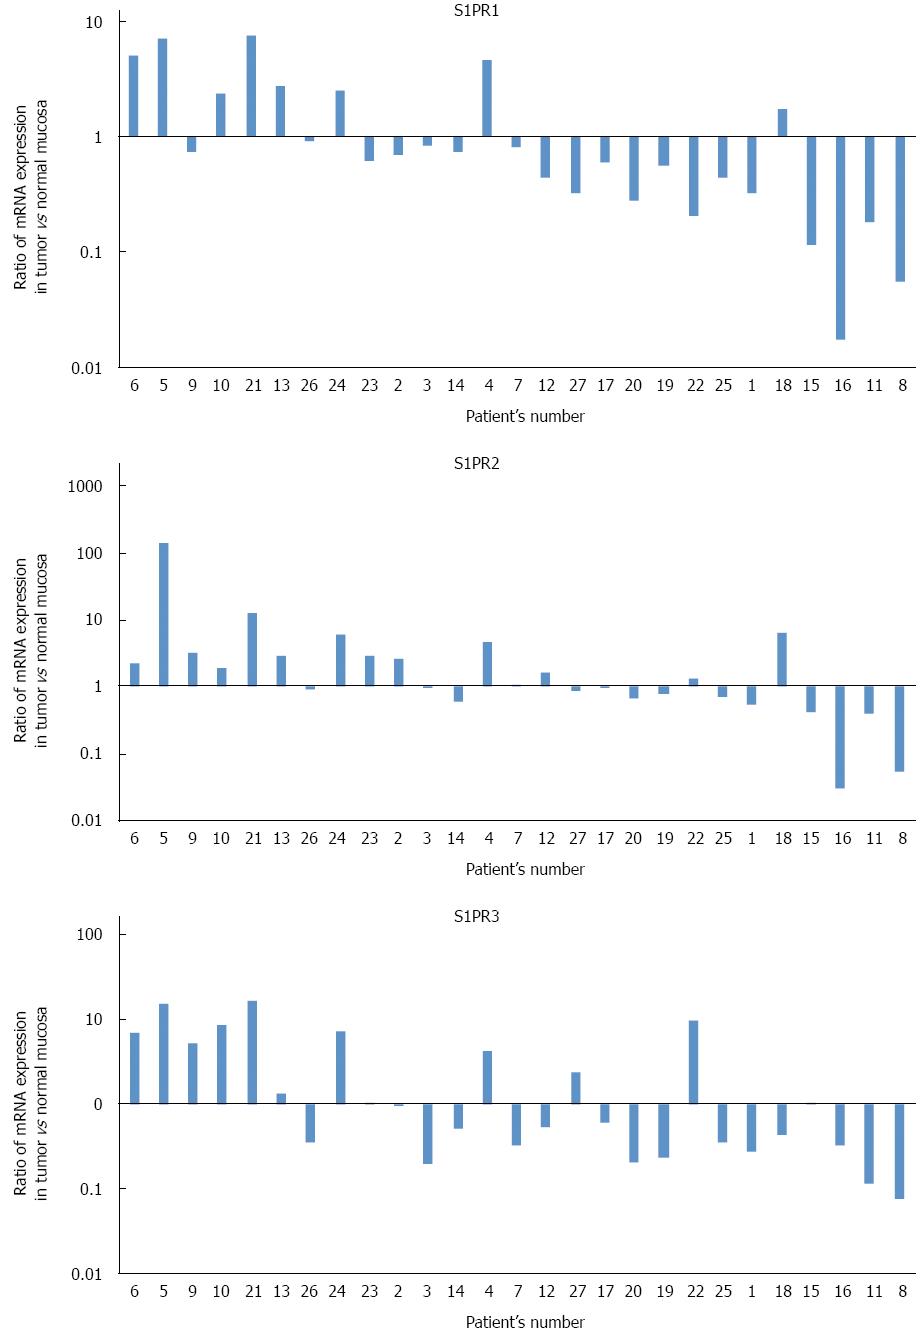
Figure 2 Ratios of sphingosine 1-phosphate receptor mRNA (S1PR1, S1PR2 and S1PR3), normalized to β-actin mRNA, in cancer tissue to those in normal tissue, as measured by real-time reverse-transcription polymerase chain reaction.
Expression profiles of all three major sphingosine 1-phosphate (S1P) receptors varied without any clear trend, with no significant difference between cancer tissue and normal tissue.
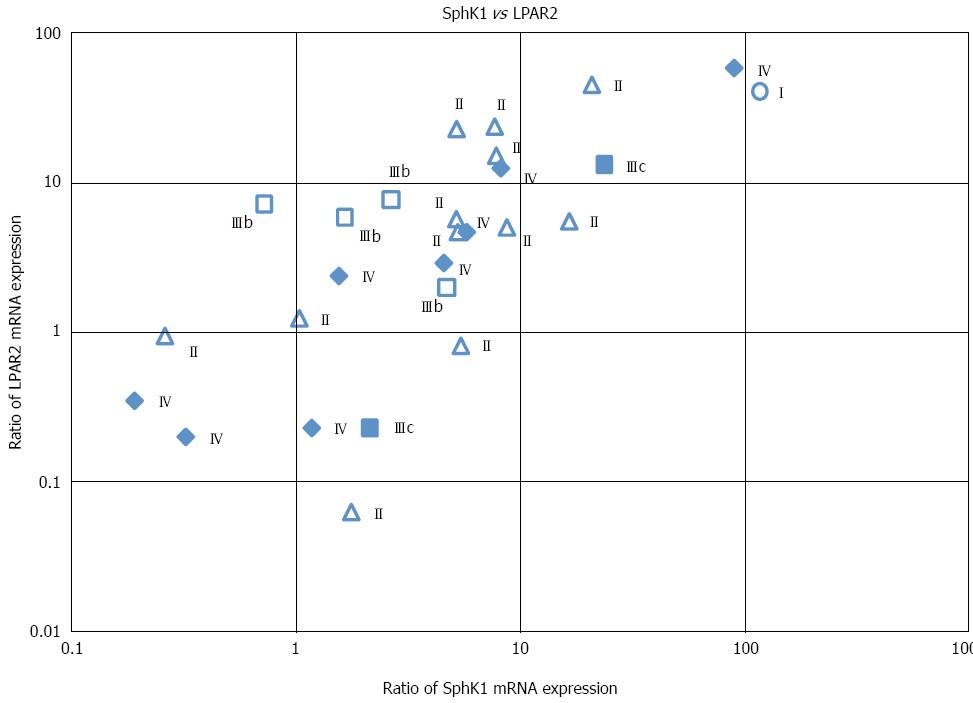
Figure 3 Correlation between SphK1 and LPAR2 mRNA expression in human colorectal cancer tissue.
Cancer stages are indicated. Pearson’s correlation coefficient (r) and the corresponding P value for the correlation were r = 0.784 and P < 0.01, respectively.
- Citation: Shida D, Inoue S, Yoshida Y, Kodaka A, Tsuji T, Tsuiji M. Sphingosine kinase 1 is upregulated with lysophosphatidic acid receptor 2 in human colorectal cancer. World J Gastroenterol 2016; 22(8): 2503-2511
- URL: https://www.wjgnet.com/1007-9327/full/v22/i8/2503.htm
- DOI: https://dx.doi.org/10.3748/wjg.v22.i8.2503


