Copyright
©The Author(s) 2016.
World J Gastroenterol. Feb 21, 2016; 22(7): 2242-2255
Published online Feb 21, 2016. doi: 10.3748/wjg.v22.i7.2242
Published online Feb 21, 2016. doi: 10.3748/wjg.v22.i7.2242
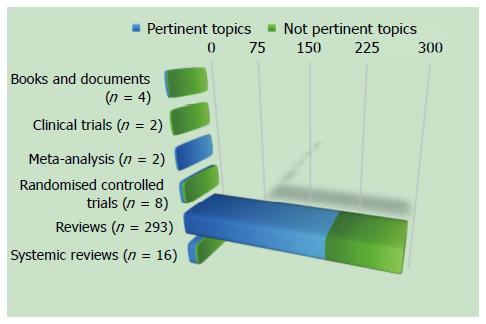
Figure 1 Literature findings on the relationship between irritable bowel syndrome and inflammation (n = 305).
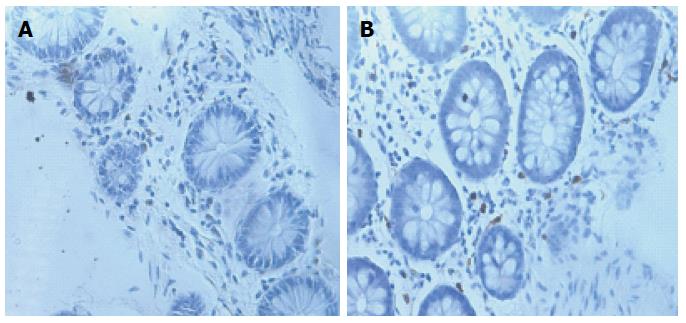
Figure 2 Immunohistochemistry for tryptase showing increases in the number of mast cells in the colonic mucosa in inflammatory bowel disease.
A: Irritable bowel syndrome patient; B: Control (× 40 magnification). Courtesy of Giancarlo Pompei, personal data.
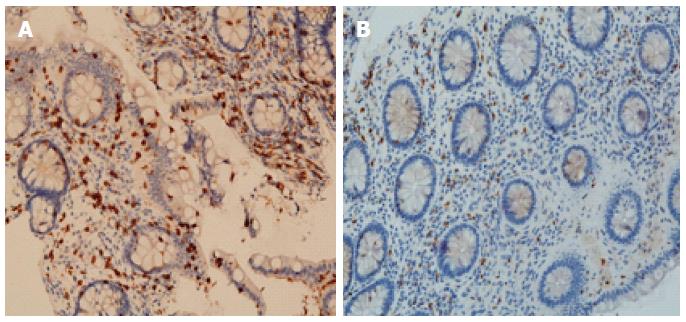
Figure 3 Immunohistochemistry for CD3 showing increase in the number of intraepithelial T-lymphocytes in the large bowel in inflammatory bowel disease.
A: Irritable bowel syndrome patient; B: Normal distribution of T-lymphocytes, which are mainly distributed within the lamina propria of the large bowel of a control patient (× 20 magnification). Courtesy of Giancarlo Pompei, personal data.
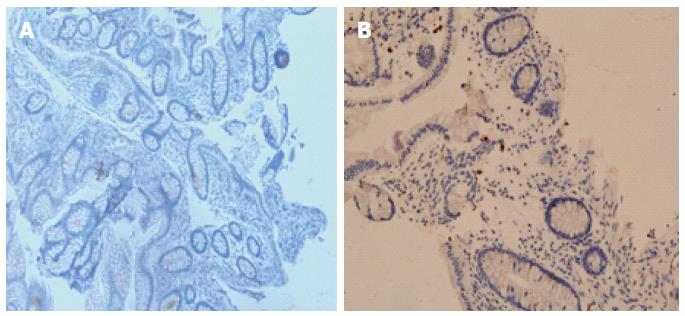
Figure 4 Immunohistochemical staining for CD20.
An equivalent distribution of B lymphocytes in the lamina propria was seen in the large intestine. A: Patient with irritable bowel syndrome; B: Control patient (× 20 magnification). Courtesy of Giancarlo Pompei, personal data.
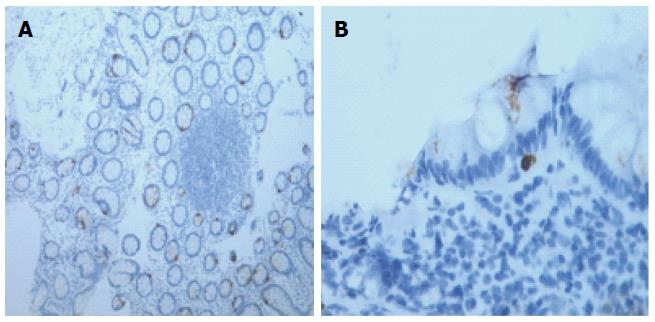
Figure 5 Immunohistochemistry for chromogranin A showing increased expression in nerve terminals at the level of the basal membrane in the large intestine in inflammatory bowel disease.
A: Irritable bowel syndrome patient; B: Control patient (× 40 magnification). Courtesy of Giancarlo Pompei, personal data.
- Citation: Sinagra E, Pompei G, Tomasello G, Cappello F, Morreale GC, Amvrosiadis G, Rossi F, Lo Monte AI, Rizzo AG, Raimondo D. Inflammation in irritable bowel syndrome: Myth or new treatment target? World J Gastroenterol 2016; 22(7): 2242-2255
- URL: https://www.wjgnet.com/1007-9327/full/v22/i7/2242.htm
- DOI: https://dx.doi.org/10.3748/wjg.v22.i7.2242


