Copyright
©The Author(s) 2016.
World J Gastroenterol. Dec 28, 2016; 22(48): 10601-10608
Published online Dec 28, 2016. doi: 10.3748/wjg.v22.i48.10601
Published online Dec 28, 2016. doi: 10.3748/wjg.v22.i48.10601
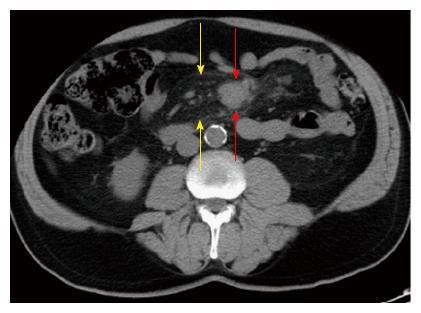
Figure 1 Mesenteric panniculitis in a patient with non-Hodgkin lymphoma.
A: Axial computed tomography (CT) scan at the level of the inferior aspect of the kidneys shows extensive mesenteric adenopathy (red arrows); B: Axial CT image obtained more caudally, at the level of the iliac crest reveals mesenteric adenopathy (red arrows) and synchronous mesenteric panniculitis (yellow arrows) characterized by hazy mesenteric fat and separation of the mesenteric vessels; C: Coronal reformatted CT image demonstrates the extensive mesenteric adenopathy (red arrows); D: Coronal reformatted CT image, take dorsal to (C) depicts synchronous mesenteric adenopathy (red arrows) and mesenteric panniculitis (yellow arrows).
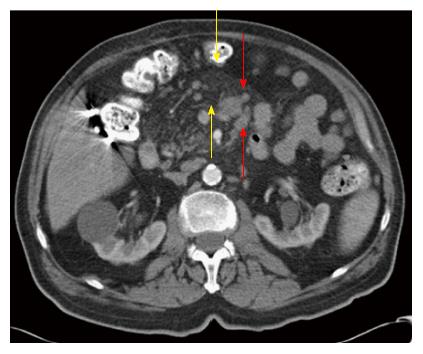
Figure 2 Mesenteric panniculitis in a patient with non-Hodgkin lymphoma.
Axial computed tomography scan shows synchronous mesenteric panniculitis (yellow arrows), manifested by fat separating the mesenteric vessels, and mesenteric adenopathy (red arrows).
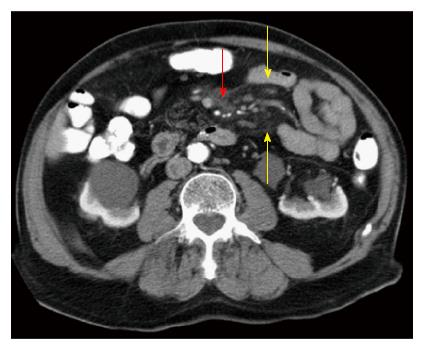
Figure 3 Mesenteric panniculitis in a patient with non-Hodgkin lymphoma.
Axial computed tomography image shows synchronous mesenteric adenopathy (red arrows) and mesenteric adenopathy (yellow arrows).
Figure 4 Mesenteric panniculitis in a patient with non-Hodgkin lymphoma (same patient as Figures 3 and 7) following chemotherapy.
Axial computed tomography image shows almost complete resolution of the mesenteric adenopathy (red arrow) but persistent mesenteric panniculitis (yellow arrows).
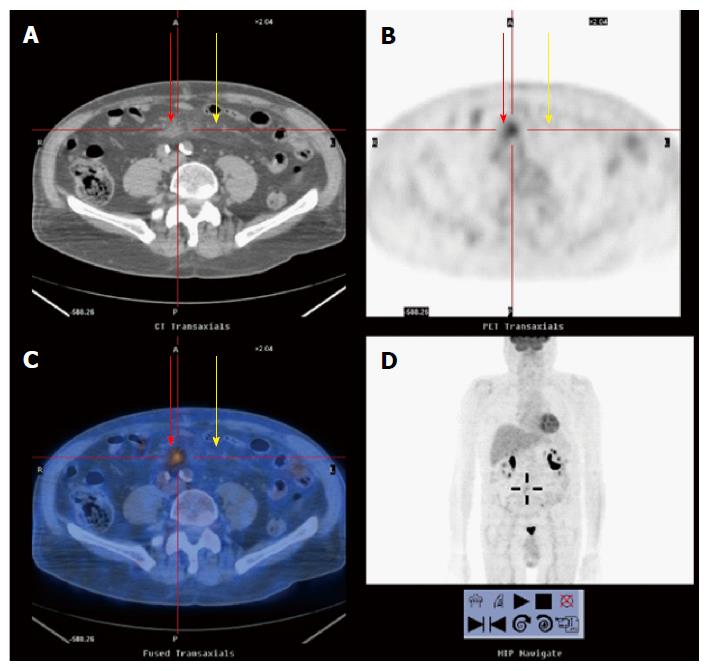
Figure 5 Mesenteric panniculitis in a patient with non-Hodgkin lymphoma.
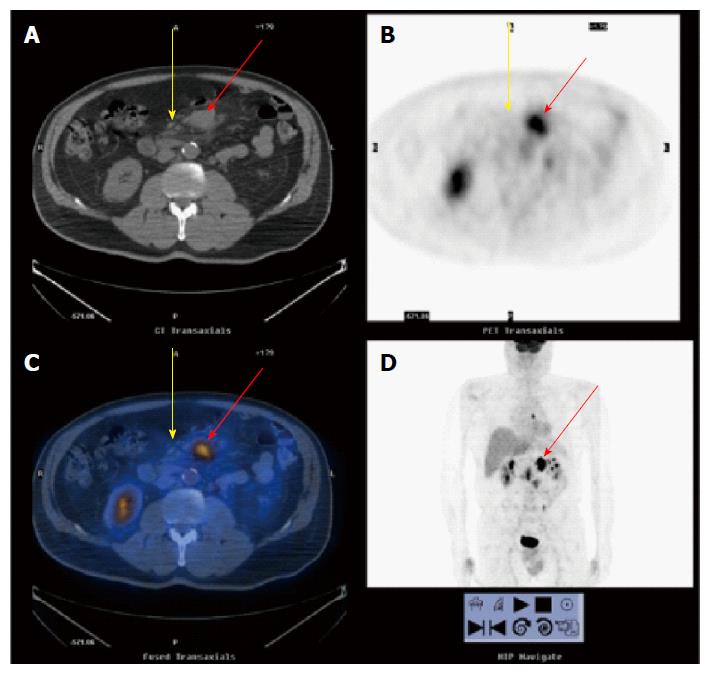
Positron emission tomography-computed tomography (PET-CT) scan following chemotherapy (same patient as Figures 3, 4 and 7). Computed tomography (CT) image (A), PET image (B), fused PET-CT image (C), and whole body PET image (D) demonstrates almost complete resolution of the mesenteric adenopathy (red arrow) with no fludeoxyglucose uptake in the portion of mesentery involved by mesenteric panniculitis (yellow arrows). The disseminated adenopathy seen in Figure 5D has almost completely resolved.
Figure 6 Mesenteric panniculitis in a patient with non-Hodgkin lymphoma (same patient as Figure 2).
Positron emission tomography-computed tomography (PET-CT) scan. CT image (A), PET image (B), fused PET-CT image (C), and whole body PET image (D) shows abnormal fludeoxyglucose uptake in the mesenteric lymph nodes containing tumor (red arrows) but not in the portion of mesentery involved by mesenteric panniculitis (yellow arrows).
Figure 7 Mesenteric panniculitis in a patient with non-Hodgkin lymphoma (same patient as Figure 3).
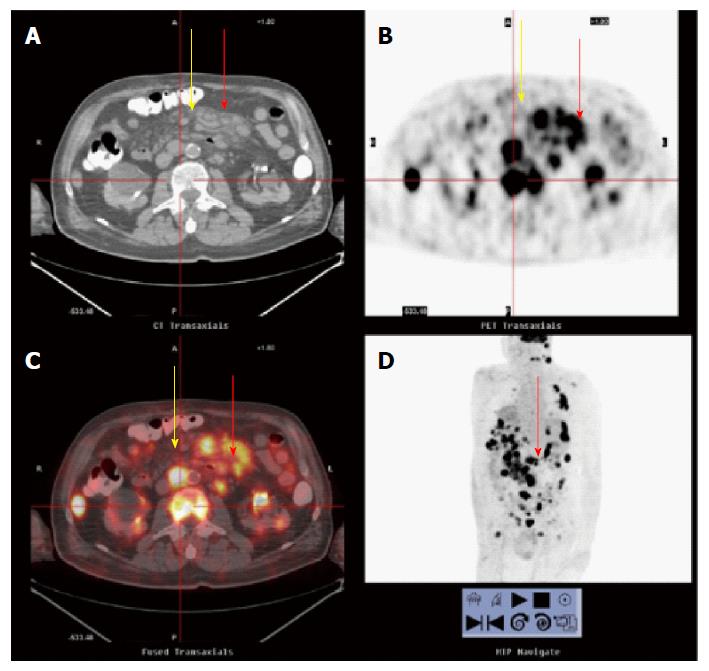
Positron emission tomography-computed tomography (PET-CT) scan. Computed tomography image (A), PET image (B), fused PET-CT image (C), and whole body PET image (D) shows abnormal fludeoxyglucose (FDG) uptake in the mesenteric lymph nodes containing tumor (red arrows) but not in the portion of mesentery involved by mesenteric panniculitis (yellow arrows). Notice the innumerable regions of abnormal FDG uptake (black regions in D) corresponding to the patient’s disseminated adenopathy.
- Citation: Ehrenpreis ED, Roginsky G, Gore RM. Clinical significance of mesenteric panniculitis-like abnormalities on abdominal computerized tomography in patients with malignant neoplasms. World J Gastroenterol 2016; 22(48): 10601-10608
- URL: https://www.wjgnet.com/1007-9327/full/v22/i48/10601.htm
- DOI: https://dx.doi.org/10.3748/wjg.v22.i48.10601


