Copyright
©The Author(s) 2016.
World J Gastroenterol. Dec 14, 2016; 22(46): 10210-10218
Published online Dec 14, 2016. doi: 10.3748/wjg.v22.i46.10210
Published online Dec 14, 2016. doi: 10.3748/wjg.v22.i46.10210
Figure 1 Trial design.
HBV: Hepatitis B virus; CHB: Chronic hepatitis B; HBeAg: Hepatitis B envelope antigen; ULN: Upper limit of normal; ALT: Alanine aminotransferase; PegIFNα-2a: Pegylated interferon-α-2a; ETV: Entecavir; Qd: Quaque die; Po: Peros.
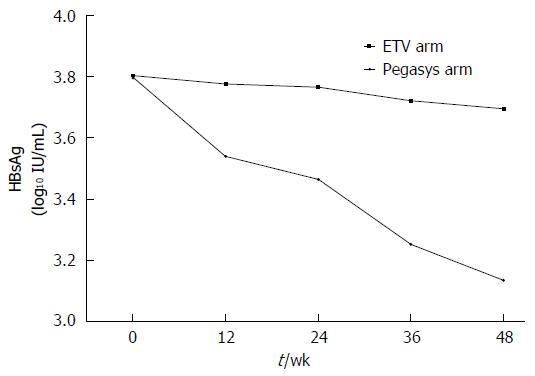
Figure 2 Hepatitis B surface antigen levels in patients in the PEGylated interferon α-2a group and the entecavir group across therapy.
HBsAg: Hepatitis B surface antigen; ETV: Entecavir.
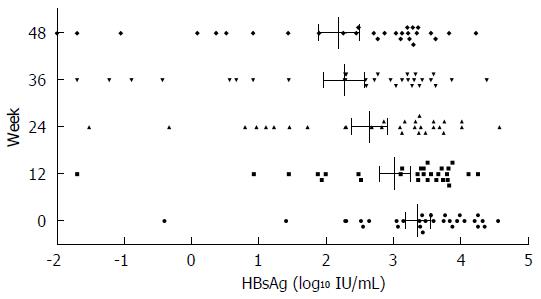
Figure 3 Change in hepatitis B surface antigen levels during PEGylated interferon α-2a sequential therapy.
HBsAg: Hepatitis B surface antigen.
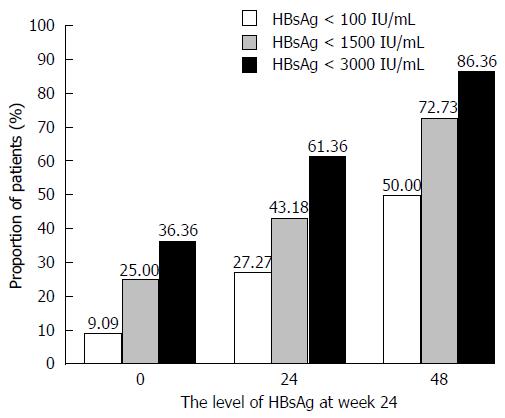
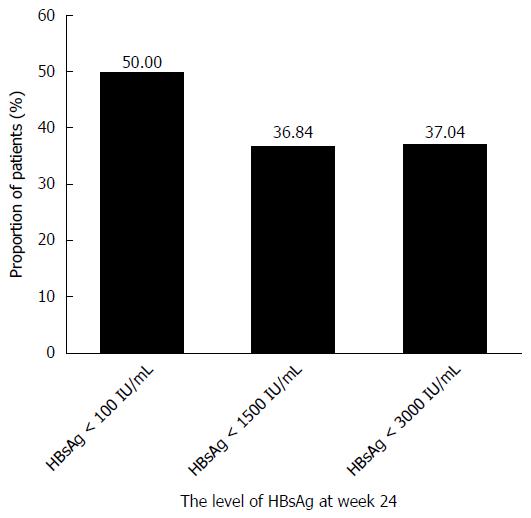
Figure 4 Proportion of patients in different hepatitis B surface antigen level groups during pegylated interferon α-2a sequential therapy.
HBsAg: Hepatitis B surface antigen.
Figure 5 The hepatitis B envelope antigen seroconversion proportion after treatment baseline at different levels of hepatitis B surface antigen at week 24 during pegylated interferon α-2a sequential therapy.
HBsAg: Hepatitis B surface antigen.
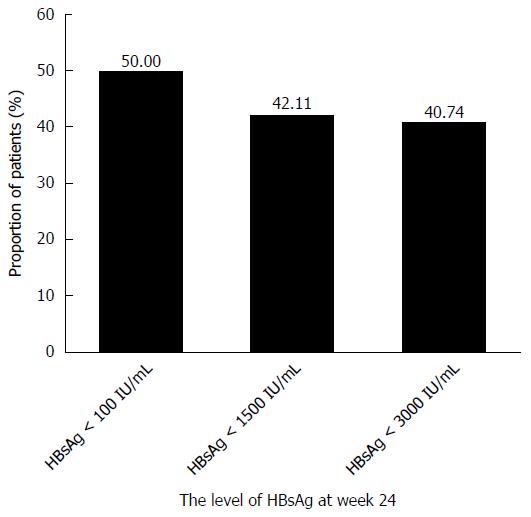
Figure 6 The proportion of hepatitis B surface antigen loss after treatment with pegylated interferon α-2a at different levels of hepatitis B surface antigen at week 24.
HBsAg: Hepatitis B surface antigen.
- Citation: He LT, Ye XG, Zhou XY. Effect of switching from treatment with nucleos(t)ide analogs to pegylated interferon α-2a on virological and serological responses in chronic hepatitis B patients. World J Gastroenterol 2016; 22(46): 10210-10218
- URL: https://www.wjgnet.com/1007-9327/full/v22/i46/10210.htm
- DOI: https://dx.doi.org/10.3748/wjg.v22.i46.10210


