Copyright
©The Author(s) 2016.
World J Gastroenterol. Dec 7, 2016; 22(45): 9880-9897
Published online Dec 7, 2016. doi: 10.3748/wjg.v22.i45.9880
Published online Dec 7, 2016. doi: 10.3748/wjg.v22.i45.9880
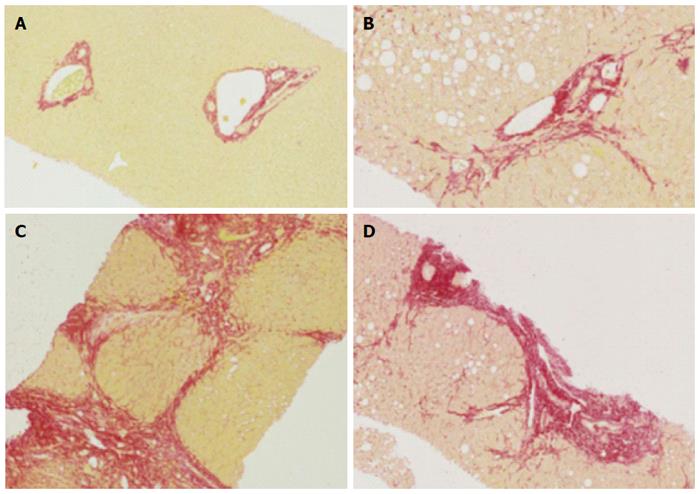
Figure 1 Histology of normal liver, fibrosis and cirrhosis.
A: Representative histological images (using Sirius red staining), normal liver; B: Mild to moderate fibrosis with portal tract expansion (METAVIR F = 2, Ishak stage 3); C: Moderate “bridging” fibrosis (METAVIR F = 3, Ishak stage 4); D: Cirrhosis (METAVIR F = 4, Ishak 5 or 6).
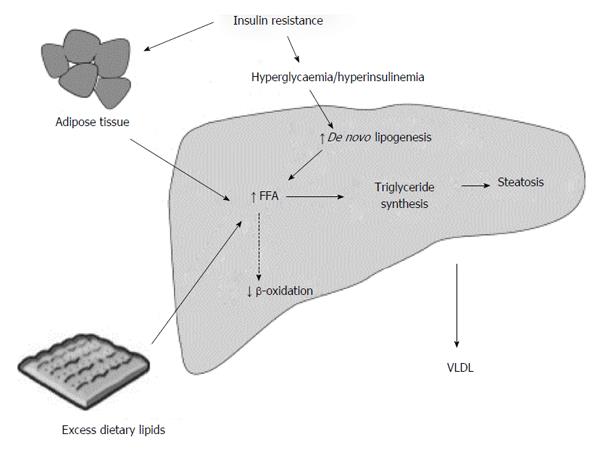
Figure 2 Summary of metabolic mechanisms leading to hepatic steatosis.
Reproduced from Dowman et al[155] with permission from Oxford University Press.
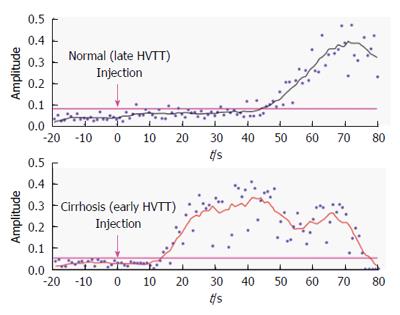
Figure 3 Hepatic vascular transit times in normal patients and patients with cirrhosis.
Time intensity curves from the hepatic vein show earlier arrival of contrast in the cirrhotic liver[83].
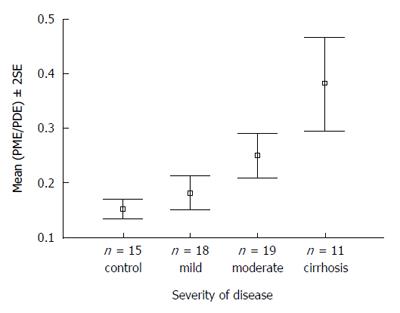
Figure 4 31P magnetic resonance spectroscopy of patients with increasing severity of liver disease vs controls.
PME/PDE ratios obtained from in vivo hepatic 31P MRS correlating with severity of liver disease in patients with hepatitis C[116]. MRS: Magnetic resonance spectroscopy; PME: Phosphomonoester; PDE: Phosphodiester.
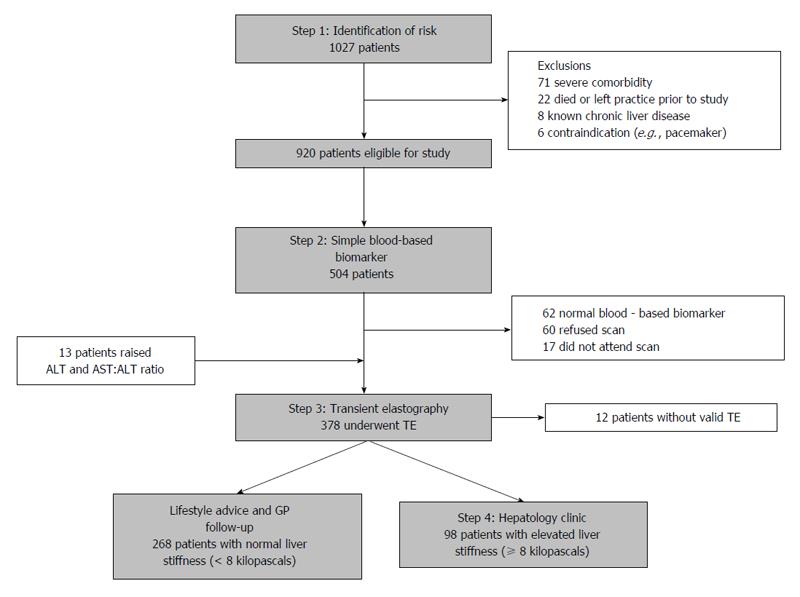
Figure 5 Diagnostic algorithm and patient flow chart of the non-invasive biomarker and transient elastography pathway[123].
ALT: Alanine aminotransferase; AST: Aspartate aminotransferase; GP: General practitioner; TE: Transient elastography.
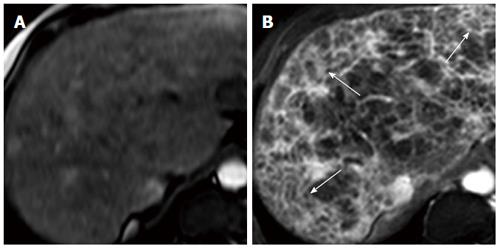
Figure 6 Transverse MR images of cirrhotic liver in vivo[128].
A: SPIO-enhanced two-dimensional spoiled gradient echo (SPGR) image with echotime of 2.65 ms; B: Double-enhanced SPGR image at the same level, showing hyperintense reticulations and hypointense nodules (arrows), thought to represent fibrous septal bands surrounding regenerative nodules.
- Citation: Karanjia RN, Crossey MME, Cox IJ, Fye HKS, Njie R, Goldin RD, Taylor-Robinson SD. Hepatic steatosis and fibrosis: Non-invasive assessment. World J Gastroenterol 2016; 22(45): 9880-9897
- URL: https://www.wjgnet.com/1007-9327/full/v22/i45/9880.htm
- DOI: https://dx.doi.org/10.3748/wjg.v22.i45.9880


