Copyright
©The Author(s) 2016.
World J Gastroenterol. Nov 28, 2016; 22(44): 9775-9783
Published online Nov 28, 2016. doi: 10.3748/wjg.v22.i44.9775
Published online Nov 28, 2016. doi: 10.3748/wjg.v22.i44.9775
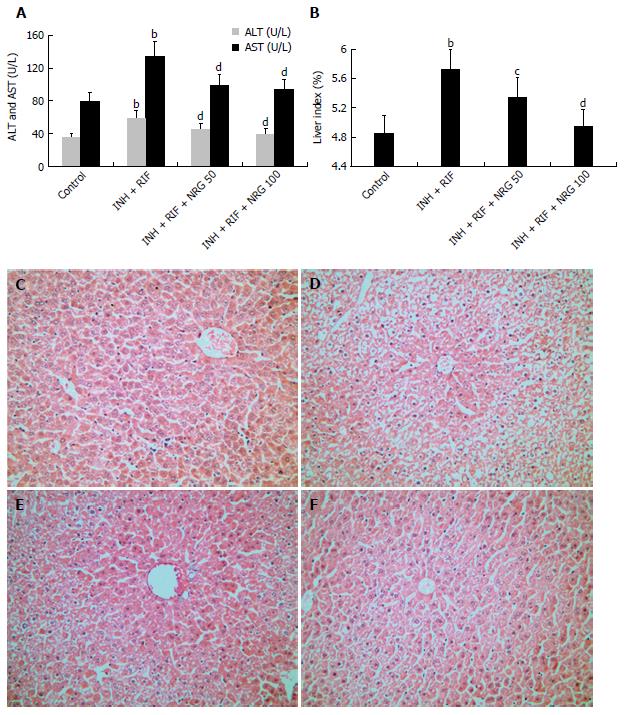
Figure 1 Naringenin pretreatment protects mice from isoniazid- and rifampicin-induced liver injury.
A: Levels of serum transaminases were analyzed; B: Liver indexes were measured. All data are expressed as means ± SEM for ten samples per group. bP < 0.01 vs control group, cP < 0.05 vs INH and RIF group, dP < 0.01 vs INH and RIF group; C: Liver section from mice treated with NSS; D: Liver section from mice treated with INH and RIF; E and F: Liver sections from mice pretreated with NRG (50 or 100 mg/kg) before INH and RIF challenge. Liver sections were stained with hematoxylin and eosin (original magnification: × 400). NRG: Naringenin; INH: Isoniazid; RIF: Rifampicin.
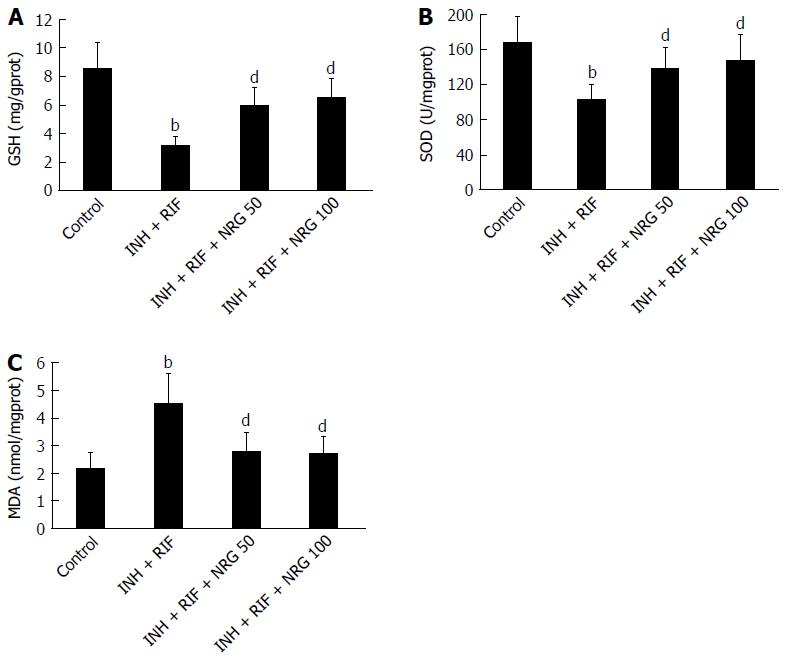
Figure 2 Naringenin pretreatment protects against isoniazid- and rifampicin-induced oxidative stress in liver.
A: GSH levels were measured; B: SOD levels were measured; C: MDA levels were measured. All data are expressed as mean ± SEM for ten samples per group. bP < 0.01 vs control group, dP < 0.01 vs INH and RIF group. NRG: Naringenin; INH: Isoniazid; RIF: Rifampicin; GSH: Glutathione; SOD: Superoxide dismutase; MDA: Malondialdehyde.
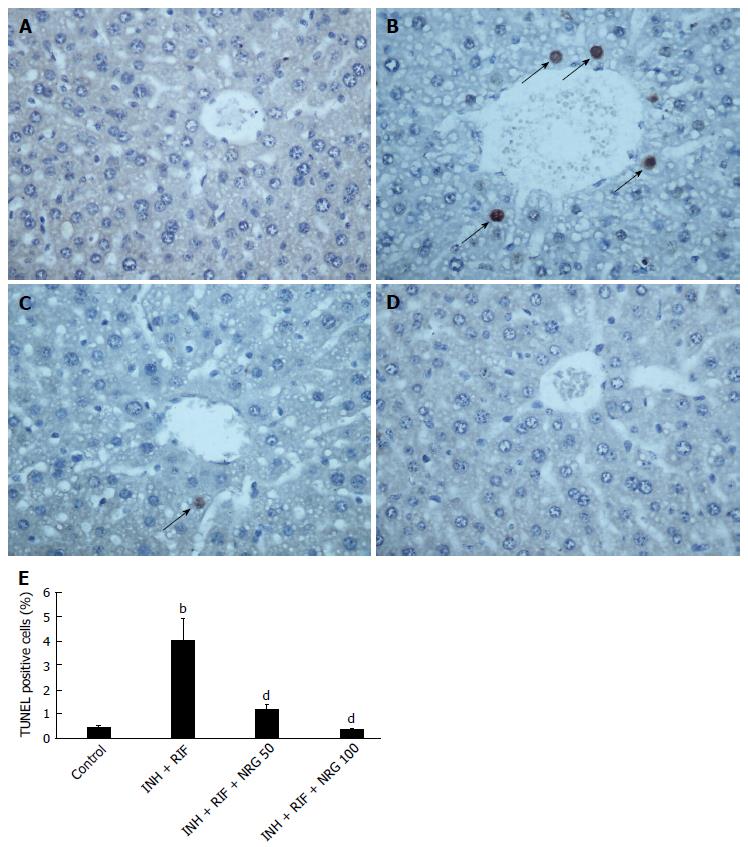
Figure 3 Naringenin pretreatment protects against isoniazid- and rifampicin-induced hepatocytes apoptosis.
A-D: Apoptosis was detected with TUNEL staining of liver sections from mice treated with NSS (A), INH and RIF (B), or pretreated with NRG (50 or 100 mg/kg) before INH and RIF challenge (C and D). The number of TUNEL positive cells (arrow) was counted in six randomly selected areas from each tissue section at magnification × 400; E: All data are expressed as mean ± SEM for six samples per group. bP < 0.01 vs control group, dP < 0.01 vs INH and RIF group. NRG: Naringenin; INH: Isoniazid; RIF: Rifampicin.
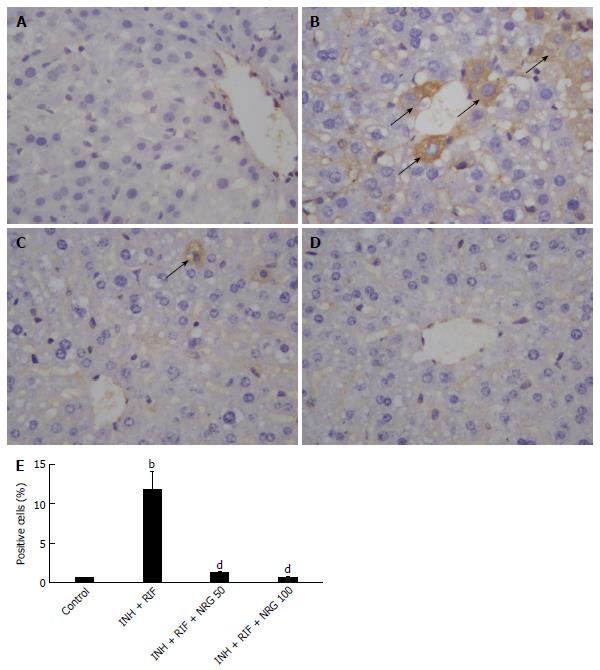
Figure 4 Effect of naringenin on isoniazid- and rifampicin-induced caspase-3 activation.
A-D: Caspase-3 activity was measured with immunohistochemical staining of liver sections from mice treated with NSS (A), INH and RIF (B), or pretreated with NRG (50 or 100 mg/kg) before INH and RIF challenge (C and D). The number of cleaved caspase-3-positive cells (arrow) was counted in six randomly selected areas from each tissue section at magnification × 400; E: All data are expressed as mean ± SEM for six samples per group. bP < 0.01 vs control group, dP < 0.01 vs INH and RIF group. NRG: Naringenin; INH: Isoniazid; RIF: Rifampicin.
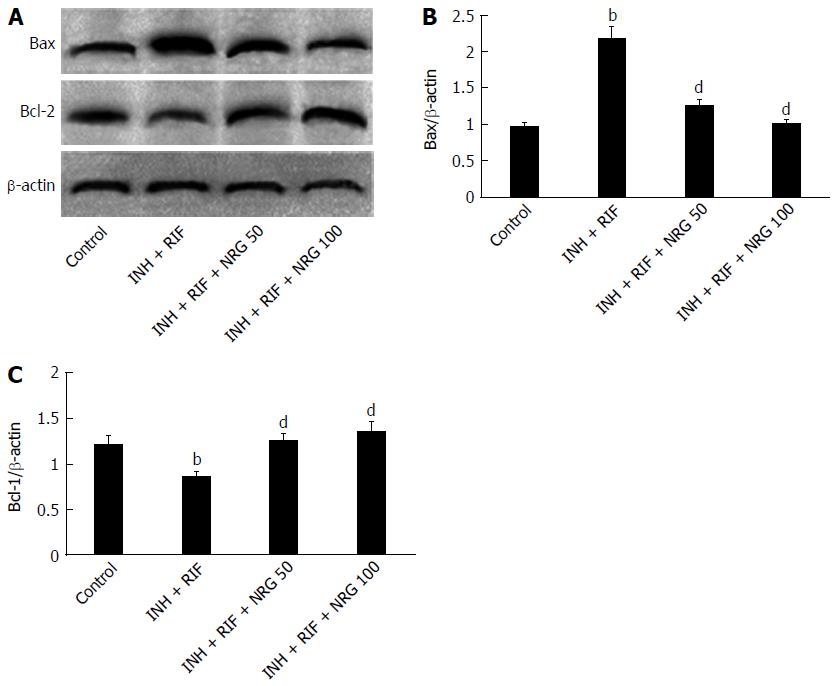
Figure 5 Effect of naringenin on Bax and Bcl-2 expression of isoniazid- and rifampicin-induced liver injury.
The protein expression of Bax and Bcl-2 was determined by western blotting. Data are expressed as mean ± SEM for six samples per group. bP < 0.01 vs control group, dP < 0.01 vs INH and RIF group. NRG: Naringenin; INH: Isoniazid; RIF: Rifampicin.
- Citation: Wang C, Fan RQ, Zhang YX, Nie H, Li K. Naringenin protects against isoniazid- and rifampicin-induced apoptosis in hepatic injury. World J Gastroenterol 2016; 22(44): 9775-9783
- URL: https://www.wjgnet.com/1007-9327/full/v22/i44/9775.htm
- DOI: https://dx.doi.org/10.3748/wjg.v22.i44.9775


