Copyright
©The Author(s) 2016.
World J Gastroenterol. Nov 21, 2016; 22(43): 9515-9524
Published online Nov 21, 2016. doi: 10.3748/wjg.v22.i43.9515
Published online Nov 21, 2016. doi: 10.3748/wjg.v22.i43.9515
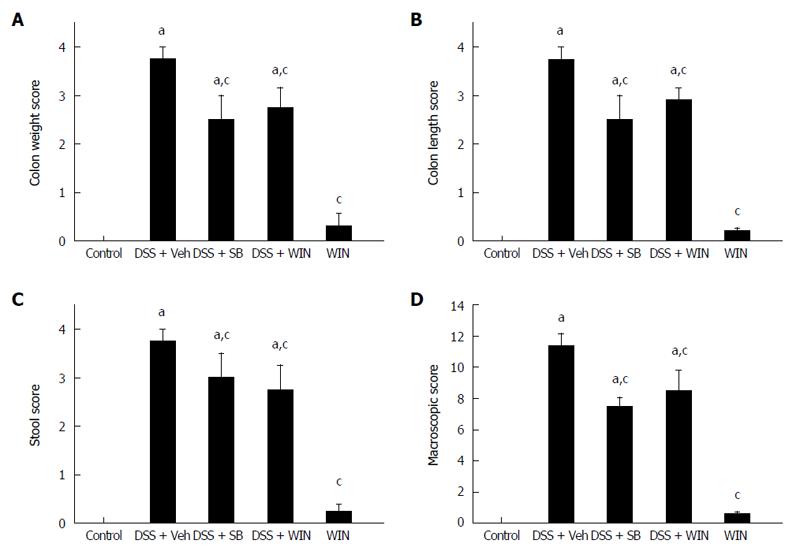
Figure 1 Macroscopical score of dextran sulfate sodium-induced colitis in C57BL/6 mice (A-D).
Macroscopical score (MS) of was calculated as described in the Materials and Methods. SB203580 (5 μmol/kg) was injected i.p. twice daily beginning from 60 h after dextran sulfate sodium (DSS) treatment inception and continuing until the last day. WIN55 (5 mg/kg) was administered i.p., once daily for 7 consecutive days, starting from DSS treatment until the end of the experiment. Data of macroscopical parameters are presented as mean ± SEM (n = 8). aP < 0.05 vs control; cP < 0.05 vs DSS + vehicle (Veh). SB: SB203580; WIN: WIN55.
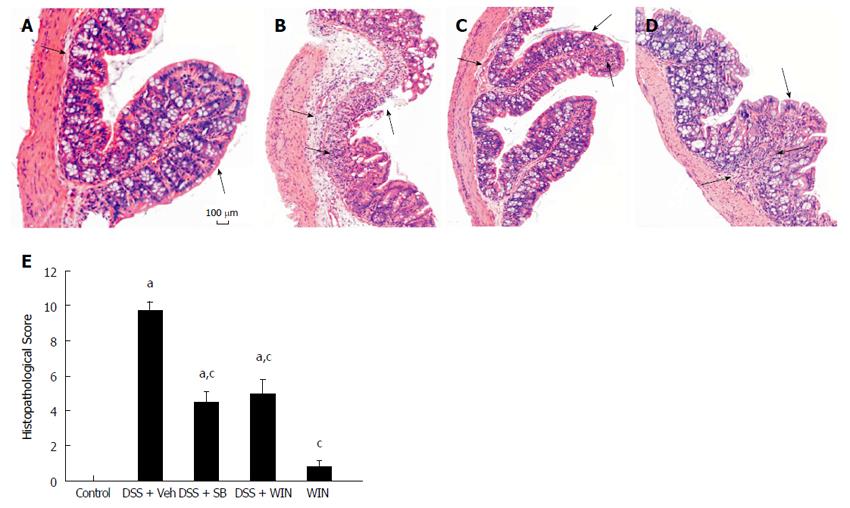
Figure 2 Histopathological score of dextran sulfate sodium-induced colitis in C57BL/6 mice.
A: Control; B: Dextran sulfate sodium (DSS) + vehicle (Veh); C: DSS + SB203580 (SB); D: DSS + WIN (WIN55). Arrows marked in the figure (HE-staining, magnification × 100, respectively) point to the damage in epithelium, or edema in the sub-mucosa, or infiltration of inflammatory cells; E: Histopathological score (HS) was calculated as described in the Materials and Methods. Data of HS are presented as mean ± SEM (n = 8). aP < 0.05 vs control; cP < 0.05 vs DSS + Veh.
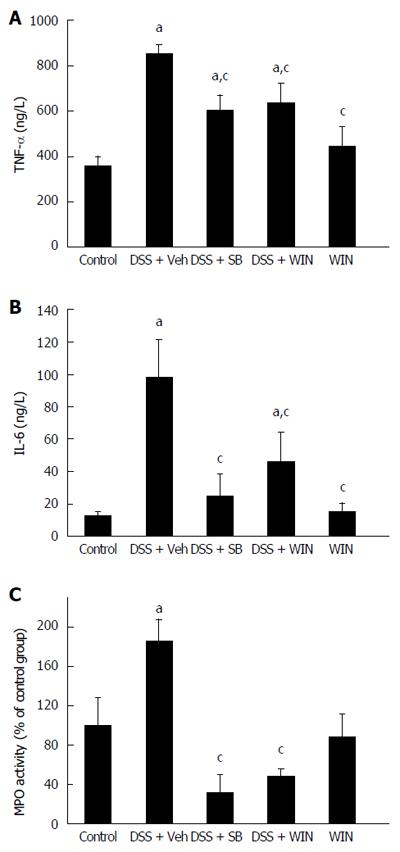
Figure 3 Levels of inflammatory mediators in plasma and myeloperoxidase activity in colon tissues (A-C).
Plasma samples and colon tissues were collected and examined as described in the Materials and Methods. Data are presented as mean ± SEM (n = 8). aP < 0.05 vs control; cP < 0.05 vs dextran sulfate sodium (DSS) + vehicle (Veh). SB: SB203580; WIN: WIN55.
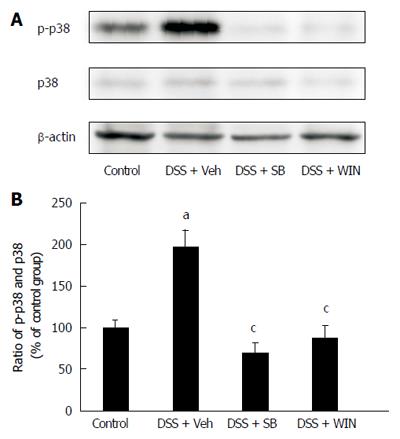
Figure 4 Expression of p38 phosphorylated form and p38 by western blot analysis.
A: The collection of colonic tissues specimens from C57BL/6 mice in different experimental groups and the western blotting operation were conducted as described in the Materials and Methods; B: Representative strips from 4 separate experiments with similar results are presented. Semi-quantitative blot analysis of p-p38 and p38 was carried out using ImageJ software. Data are presented as mean ± SD (n = 4). aP < 0.05 vs control; cP < 0.05 vs dextran sulfate sodium (DSS) + vehicle (Veh). SB: SB203580; WIN: WIN55.
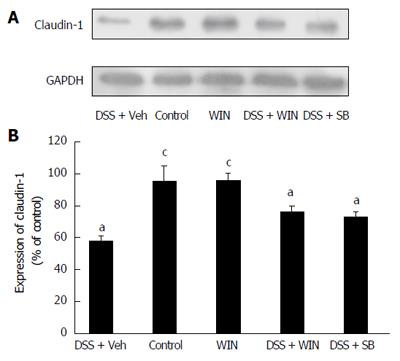
Figure 5 Expression of claudin-1 by western blot analysis.
Sample collection of colonic tissues from C57BL/6 mice and western blotting operation were performed as described in the Materials and Methods. A: A representative strip; B: The result of semi-quantitative gel analysis of claudin-1 as determined by ImageJ software. Data are presented as mean ± SD (n = 4). aP < 0.05 vs control; cP < 0.05 vs dextran sulfate sodium (DSS) + vehicle (Veh). SB: SB203580; WIN: WIN55.
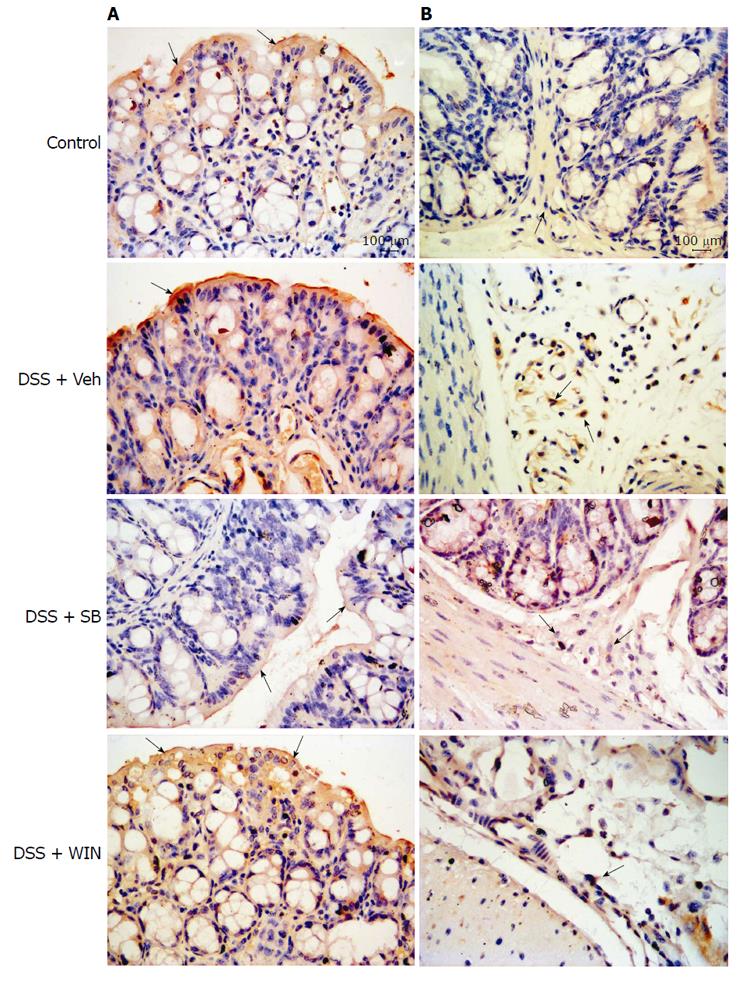
Figure 6 Representative figures of the expression of cannabinoid receptor type 1 and type 2 receptors in mouse colon by immunohistochemistry staining, which are from 4 separate experiments with similar results.
A: Expression of cannabinoid (CB)1 receptors; B: Expression of CB2 receptors; (magnification × 400, respectively). The expressions of CB1 receptor in the colonic epithelial cells and CB2 receptor in the submucosal immune cells are marked by arrows and presented as positive results with brown-yellow staining.
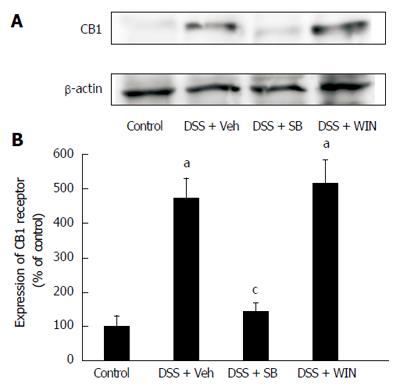
Figure 7 Expression of cannabinoid receptor type 1 by western blot analysis.
A: Collection of colonic tissues specimens from C57BL/6 mice in different experimental groups and the western blotting operation were performed as described in the Materials and Methods; B: Representative strips from 4 separate experiments with similar results are presented. Semi-quantitative blot analysis of cannabinoid (CB)1 receptors was carried out by ImageJ software. Data are presented as mean ± SD (n = 4). aP < 0.05 vs control; cP < 0.05 vs dextran sulfate sodium (DSS) + vehicle (Veh).
- Citation: Feng YJ, Li YY, Lin XH, Li K, Cao MH. Anti-inflammatory effect of cannabinoid agonist WIN55, 212 on mouse experimental colitis is related to inhibition of p38MAPK. World J Gastroenterol 2016; 22(43): 9515-9524
- URL: https://www.wjgnet.com/1007-9327/full/v22/i43/9515.htm
- DOI: https://dx.doi.org/10.3748/wjg.v22.i43.9515


