Copyright
©The Author(s) 2016.
World J Gastroenterol. Nov 14, 2016; 22(42): 9400-9410
Published online Nov 14, 2016. doi: 10.3748/wjg.v22.i42.9400
Published online Nov 14, 2016. doi: 10.3748/wjg.v22.i42.9400
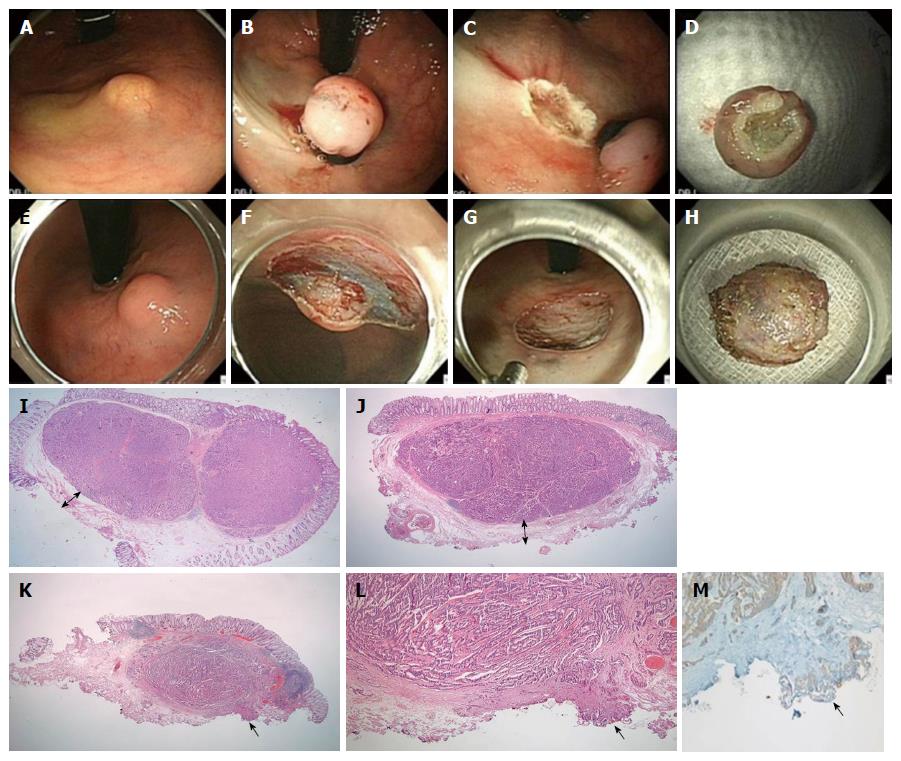
Figure 1 Endoscopic submucosal resection with a ligation device.
A: NET 2 cm from anal verge; B: Aspiration of the lesion into the ligator device and deployment of the elastic band; C: Conventional snare resection below the band; D: En bloc specimen; E-H: ESD; E: NET 2 cm from the anal verge; F: Dissection with Dual Knife; G: Resection base; H: En bloc specimen; I, J: Magnified scans of H&E slides show a well-demarcated submucosal tumor with clear vertical resection margins following ESMR-L (I) and ESD (J); I-J: The vertical resection is negative (R0) and the “safety resection margin” (arrow) between the deepest margin of the tumor and the endoscopic vertical resection margin is measured; K: The magnified scan of an H&E slide of ESD shows tumor involvement in the vertical resection margin; L: The resection margin, indicated by the arrow, is involved with the neuroendocrine tumor (R1) (× 200); M: The involved tumor cells are confirmed as positive for synaptophysin (× 200).
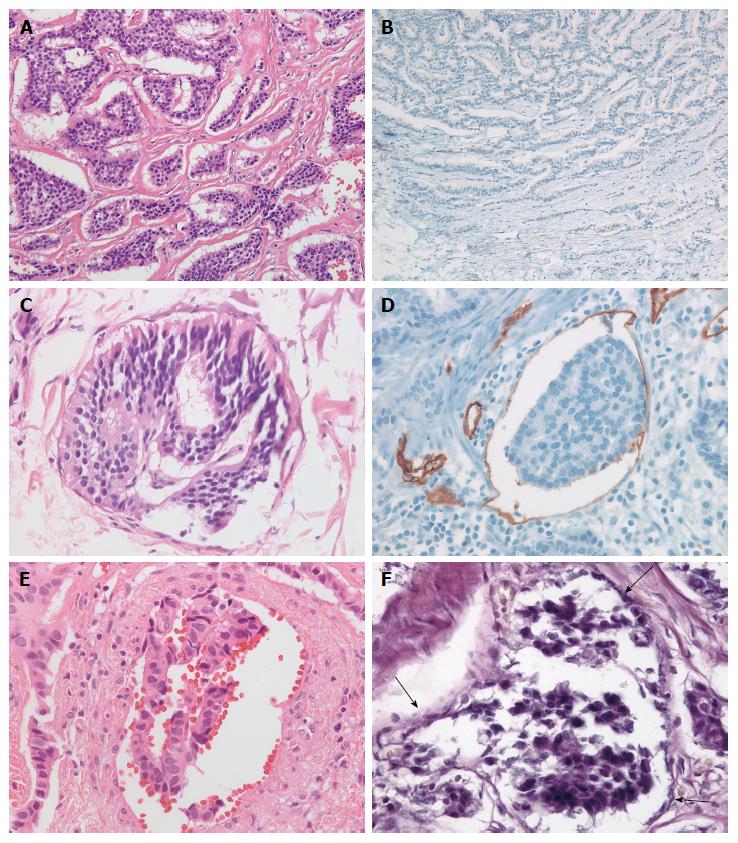
Figure 2 Ancillary staining methods.
A: Rectal neuroendocrine tumors show irregular but well-demarcated islands of uniform tumor cells separated by a fibrotic stroma; B: Negative staining for D2-40 reveals retraction cleft from the surrounding fibrotic stroma; C: Lymphatic tumor invasion with thin, endothelial cell lining on H&E is identified; D: The tumor emboli in D2-40-stained lymphatic vessels reveal the recognition of lymphatic invasion; E: Vascular invasion in H&E; F: Elastica van Gieson stain reveals vascular invasion of tumor cells (arrow).
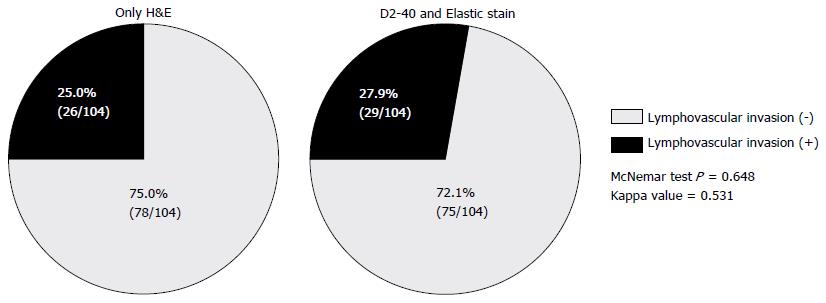
Figure 3 Comparison of pie charts of detected frequencies of lymphovascular invasion between only hematoxylin and eosin histology and acillary stains of D2-40 or Elastica van Gieson stain.
H&E: Hematoxylin and eosin.
- Citation: Kwon MJ, Kang HS, Soh JS, Lim H, Kim JH, Park CK, Park HR, Nam ES. Lymphovascular invasion in more than one-quarter of small rectal neuroendocrine tumors. World J Gastroenterol 2016; 22(42): 9400-9410
- URL: https://www.wjgnet.com/1007-9327/full/v22/i42/9400.htm
- DOI: https://dx.doi.org/10.3748/wjg.v22.i42.9400


