Copyright
©The Author(s) 2016.
World J Gastroenterol. Nov 14, 2016; 22(42): 9368-9377
Published online Nov 14, 2016. doi: 10.3748/wjg.v22.i42.9368
Published online Nov 14, 2016. doi: 10.3748/wjg.v22.i42.9368
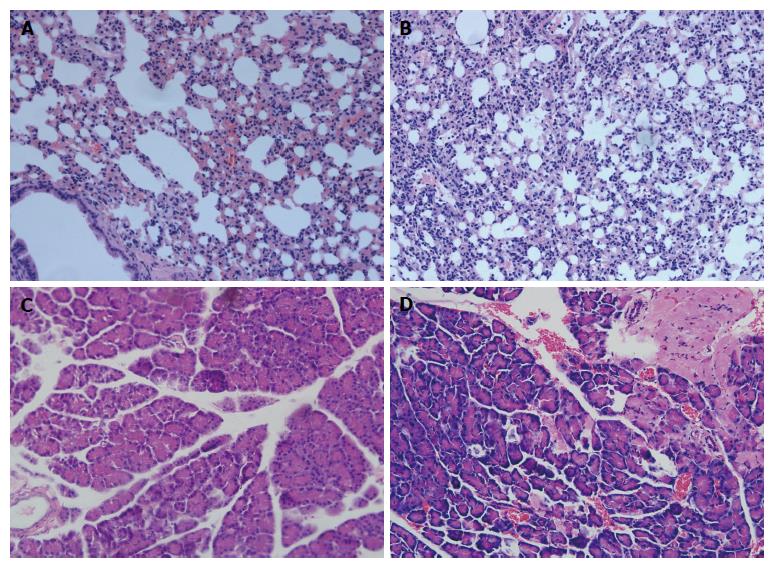
Figure 1 Histological examination of lung and pancrease stained with hematoxylin and eosin staining.
A: Lung of control rats; B: Lung of acute pancreatitis (SAP) rats; C: Pancreas of control rats; D: Pancreas of SAP rats. There were no remarkable pathologic changes in control rats (A, C); Significant inflammatory cell infiltration was observed in the SAP group. The typical pathological changes of SAP associated with acute lung injury, including lung edema, necrosis, hemorrhage and neutrophil infiltration, were seen in SAP group (B). The histological changes of pancreas tissue such as the infiltration of neutropils, macrophages, interstitial edema, hemorrhage and focal necrotic areas were seen in the pancreas tissue of SAP group (D). Original magnification × 200 (A-D).
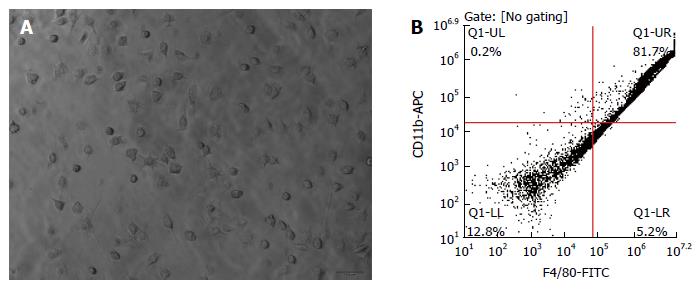
Figure 2 Identification of lung macrophages.
A: Lung alveolus macrophages were identified by microscopy (original magnification × 200); B: The purity of lung macrophages cells was examined by fluorescence-activated cell sorting as CD11b/c, F4/80 positive cells after primary culture for 24 h.
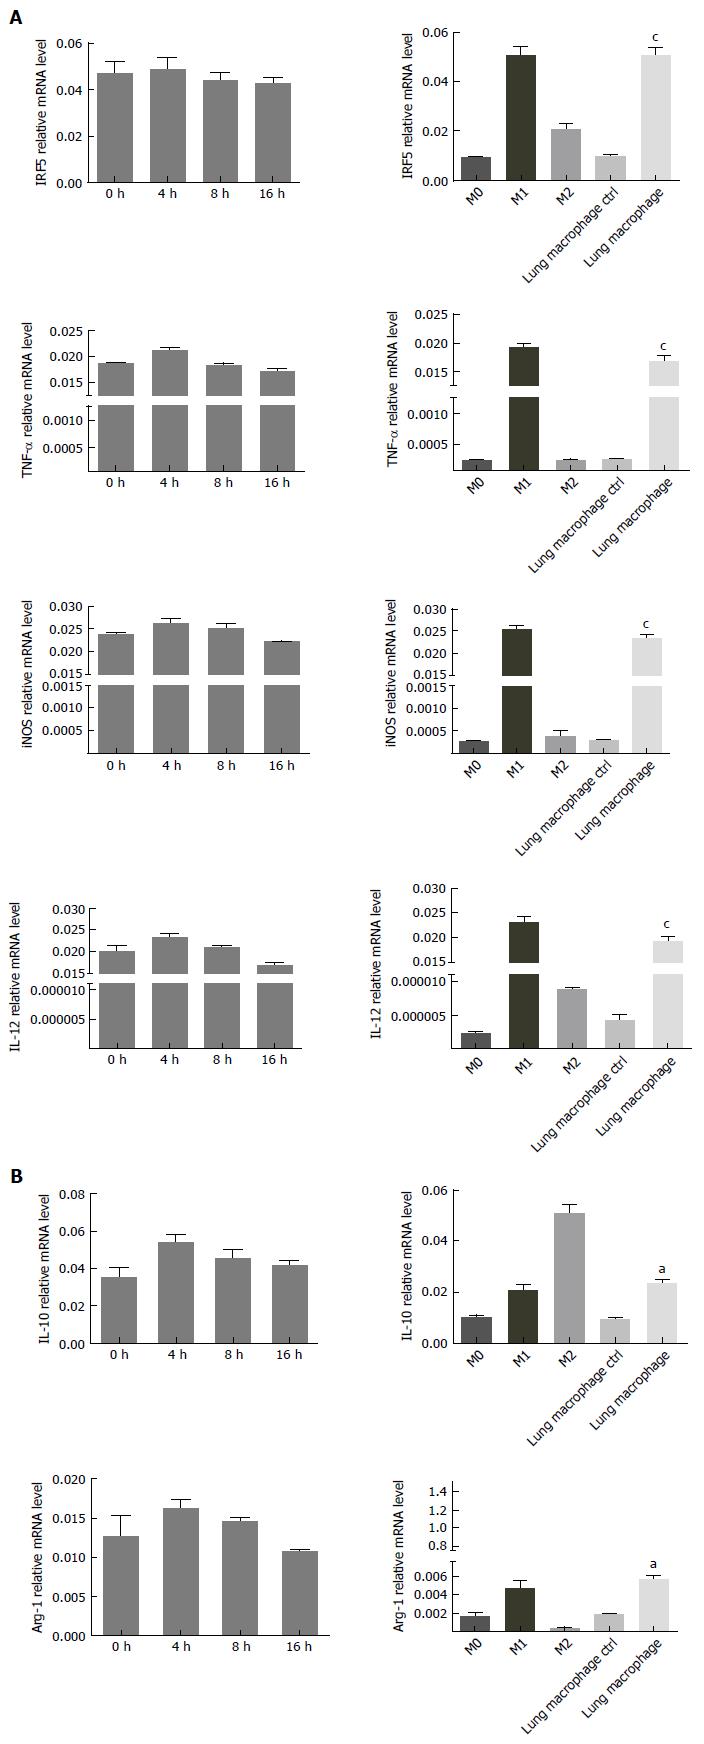
Figure 3 Expression of M1 phenotype of lung alveolus macrophages during early phase of acute pancreatitis.
The expression of major M1 phenotypes [interferon regulatory factor 5 (IRF5), TNF-, iNOS and IL-12] and M2 phenotypes (IL-10 and Arg-1) were detected by real-time polymerase chain reaction (RT-PCR). The polarization of lung macrophages was detected by RT-PCR. A: mRNA levels of M1 phenotypes in the macrophages; B: mRNA levels of M2 markers in the macrophages. The statistical significance was analyzed in comparison with the CTRL groups (M0, M1). aP < 0.05, cP < 0.01 vs control.
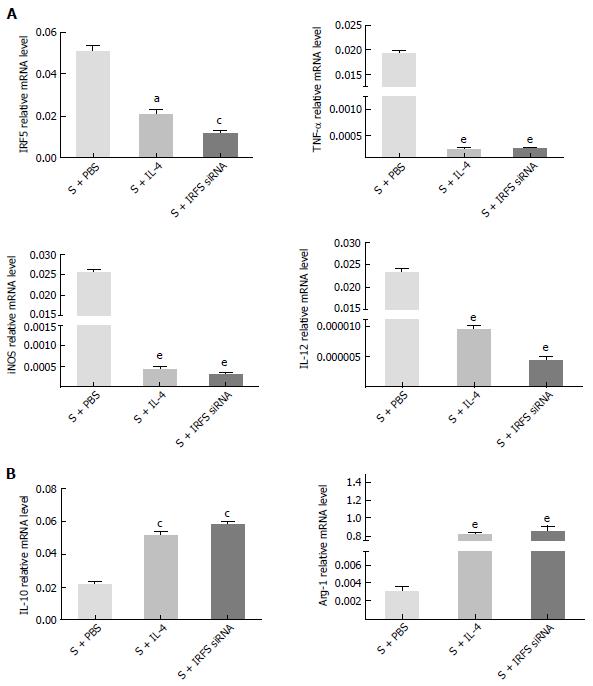
Figure 4 Reversion of the polarization of lung macrophages in acute pancreatitis group.
Lung alveolus macrophages were obtained 24 h after acute pancreatitis (SAP) model establishment and respectively treated with PBS, IL-4 or interferon regulatory factor 5 (IRF5) siRNA for 8 h (S + PBS, S + IL-4, S + IRF5 siRNA group). The M1/M2 phenotypes were detected by real-time polymerase chain reaction. A: mRNA levels of M1 phenotypes in the macrophages; B: mRNA levels of M2 phenotypes in the macrophages. The statistical significance was analyzed in comparison with the CTRL group (S + PBS). Error bars indicate the mean ± SE. aP < 0.05, cP < 0.01, eP < 0.001 vs control. S: Lung alveolus macrophages from the mouse SAP model.
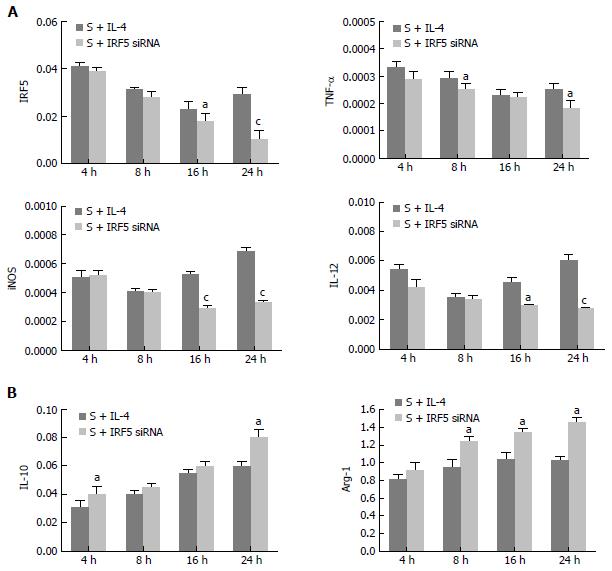
Figure 5 Comparison of the ability to reverse lung macrophage polarization by interferon regulatory factor 5 siRNA/IL-4.
Lung macrophages were treated with interferon regulatory factor 5 (IRF5) siRNA/IL-4 for 4, 8, 16 and 24 h. The M1/M2 phenotypes were detected by real-time polymerase chain reaction. A: mRNA levels of M1 phenotypes in the macrophages; B: mRNA levels of M2 phenotypes in the macrophages. The statistical significance was analyzed when the two groups were compared in the same time point using indifferent t test. Error bars indicate the mean ± SE. aP < 0.05, cP < 0.01 vs control.
- Citation: Sun K, He SB, Qu JG, Dang SC, Chen JX, Gong AH, Xie R, Zhang JX. IRF5 regulates lung macrophages M2 polarization during severe acute pancreatitis in vitro. World J Gastroenterol 2016; 22(42): 9368-9377
- URL: https://www.wjgnet.com/1007-9327/full/v22/i42/9368.htm
- DOI: https://dx.doi.org/10.3748/wjg.v22.i42.9368


