Copyright
©The Author(s) 2016.
World J Gastroenterol. Oct 14, 2016; 22(38): 8528-8539
Published online Oct 14, 2016. doi: 10.3748/wjg.v22.i38.8528
Published online Oct 14, 2016. doi: 10.3748/wjg.v22.i38.8528
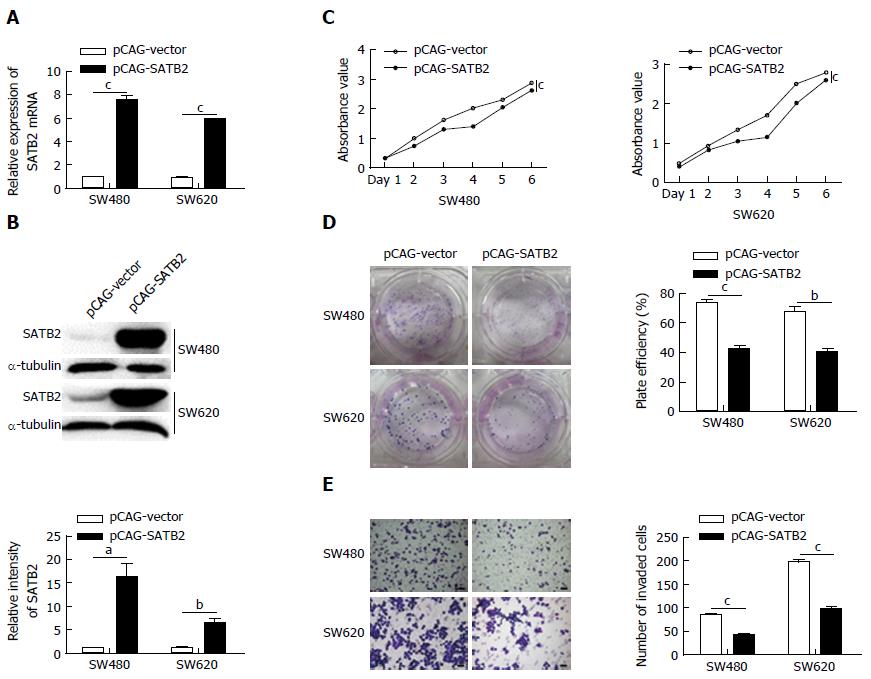
Figure 1 Overexpression of special AT-rich sequence-binding protein 2 inhibits the proliferation and migration of colorectal cancer cells in vitro.
A, B: Expression levels of SATB2 in SW480 and SW620 cells transfected with pCAG-SATB2 were increased whenever detected by qRT-PCR (A) or Western blot (B); C: The proliferation abilities of cells with SATB2 overexpression were detected to have a decrease in CCK-8 cell proliferation assay. The P-values of time effect, group effect and their interaction effect were all below 0.001 in SW480 and DLD-1 cells; D: Colony formation assay was used to analyze ability of clone formation in SATB2 overexpressing cells. Cells with SATB2 overexpression formed less clones; E: Cell migration capacities of control cells and SATB2 overexpressing cells were compared by detecting the invaded cell numbers in transwell chambers. Fewer invaded cells were found in SATB2 overexpressing cells. Scale bar is 50 μm. Data shown are mean ± SEM. aP < 0.05, bP < 0.01, cP < 0.001 vs control.
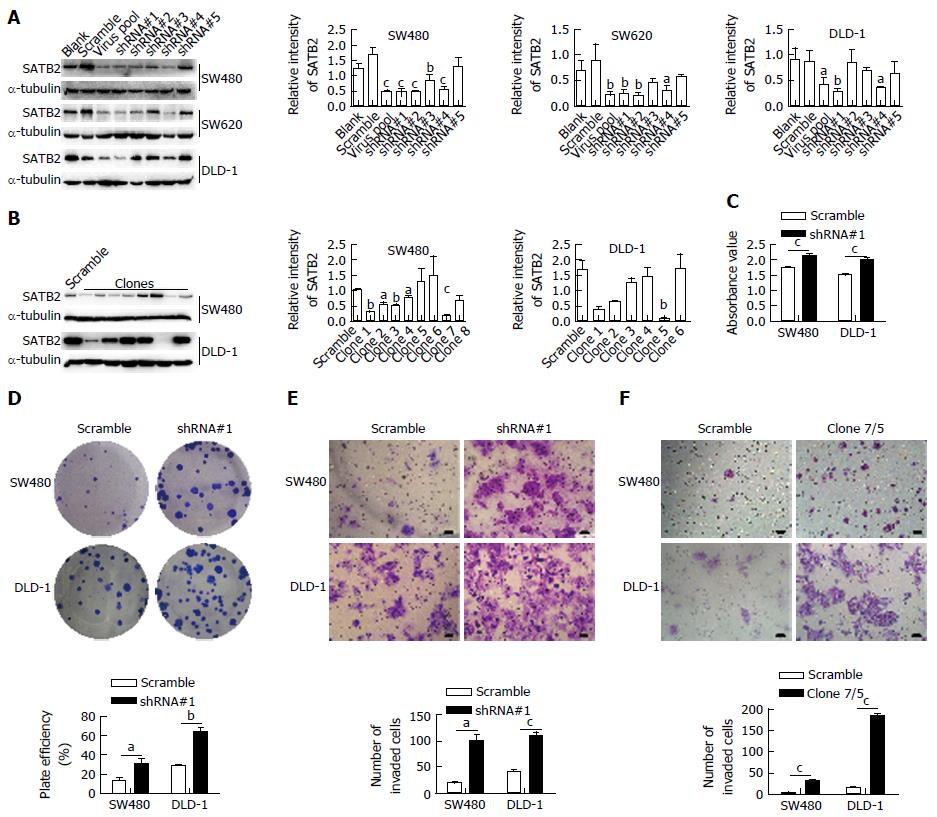
Figure 2 Knockdown of special AT-rich sequence-binding protein 2 promotes adhesion, colony-formation and migration of colorectal cancer cells in vitro.
A: SATB2 expression levels in cells infected by virus with different shRNAs targeting SATB2 were detected by Western blot. shRNA named shRNA#1 had the best effect in silencing SATB2 expression in SW480, SW620 and DLD-1 cells; B: Cells in which SATB2 was stably knocked down were isolated into single cells and single cells were cultured for 2 wk to form clones. Then we detected SATB2 expression in different clones by Western blot. We chose SW480/clone7 and DLD-1/clone5 cells to be used in the following assays; C: Adhesion capabilities of cells infected by shRNA#1 virus and its control virus were compared by detecting the cells’ absorbance values to reflect the numbers of adhered cells. Cells with low SATB2 expression had increased adhesion capabilities; D: Abilities of clone formation of CRC cells with stably reduced expression of SATB2 by an infection of shRNA#1 virus were detected to have an increase in colony formation assay; E and F: Transwell chambers were used to detect migration ability of cells with stably reduced expression of SATB2 by an infection of shRNA#1 virus (E) or by culturing the single cells isolated from shRNA#1 virus infected cells to clones (F) and both groups with low SATB2 expression had increased cell migration abilities. Scale bar is 50 μm. Data shown are mean ± SEM. aP < 0.05, bP < 0.01, cP < 0.001 vs control.
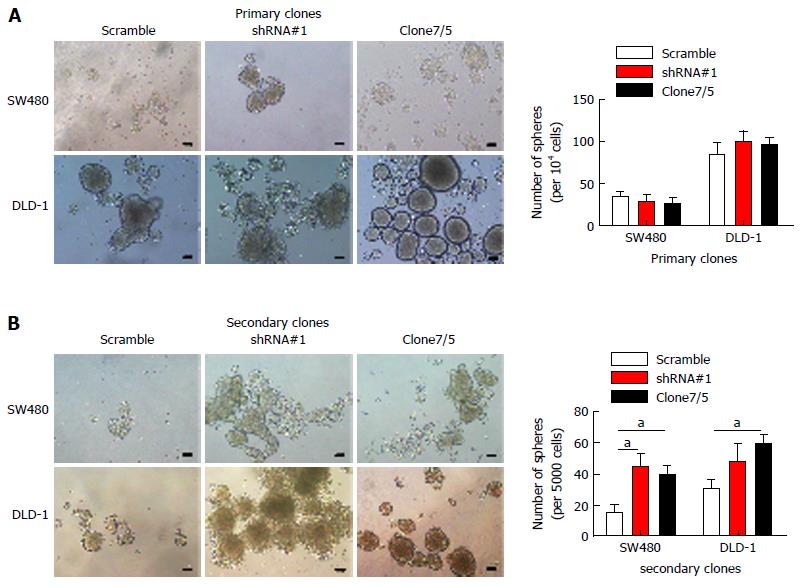
Figure 3 Special AT-rich sequence-binding protein 2 knockdown enhances secondary sphere formation of colorectal cancer cells in vitro.
A: Self-renewal abilities of CRC cells in which SATB2 was stably knocked down were evaluated by sequential sphere formation assay; B: Spheres formed primarily were isolated into single cells and then equal amounts of cells were cultured to form secondary spheres. More secondary spheres were formed in SATB2 downregulated cells in SW480 and DLD-1. Scale bar is 50 μm. Data shown are mean ± SEM. aP < 0.05 vs control.
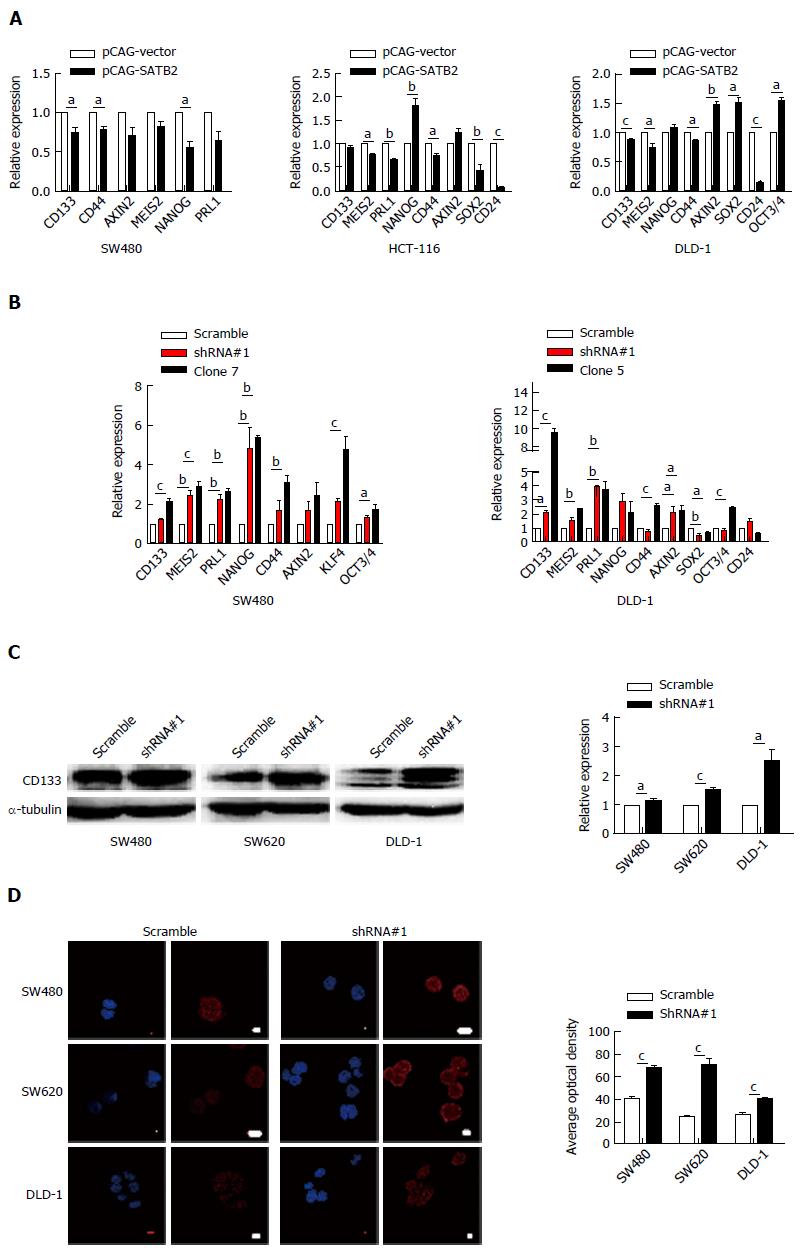
Figure 4 Special AT-rich sequence-binding protein 2 knockdown increases the expression of several markers for cancer stem cells in colorectal cancer cells in vitro.
A-B: The mRNA expression of a series of stem cell markers was detected in SATB2 overexpressing cells (A) and SATB2 knockdown cells (B) by qRT-PCR; C-D: CD133 expression level in cells with stable SATB2 knockdown was increased when detected by Western blot (C) and immunofluorescence (D). Scale bar is 10 μm. Data shown are mean ± SEM. aP < 0.05, bP < 0.01, cP < 0.001, vs control.
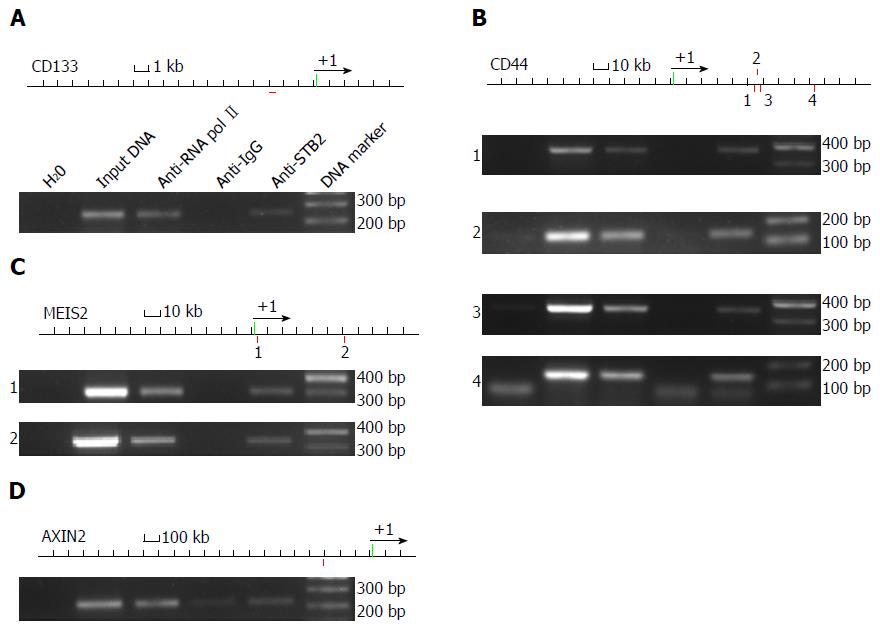
Figure 5 Special AT-rich sequence-binding protein 2 binds to regulatory elements of CD133, CD44, MEIS2 and AXIN2 genes.
A-D: ChIP was carried out with anti-SATB2 antibody, anti-RNA pol II antibody and anti-IgG antibody. Input DNA and immunoprecipitated DNA by anti-RNA pol II antibody were used as positive controls. Immunoprecipitated DNA by anti-IgG antibody and H2O were used as negative controls. PCR was used to find out the genomic binding sites for each gene. Red squares under the genomic sequence mean the predicted Satb2-binding loci. Green boxes mean the exons for each genomic sequence. Black arrows mean the translation initiation sites. As expected, SATB2 bound CD133 (A), CD44 (B), MEIS2 (C) and AXIN2 (D) at their regulatory elements.
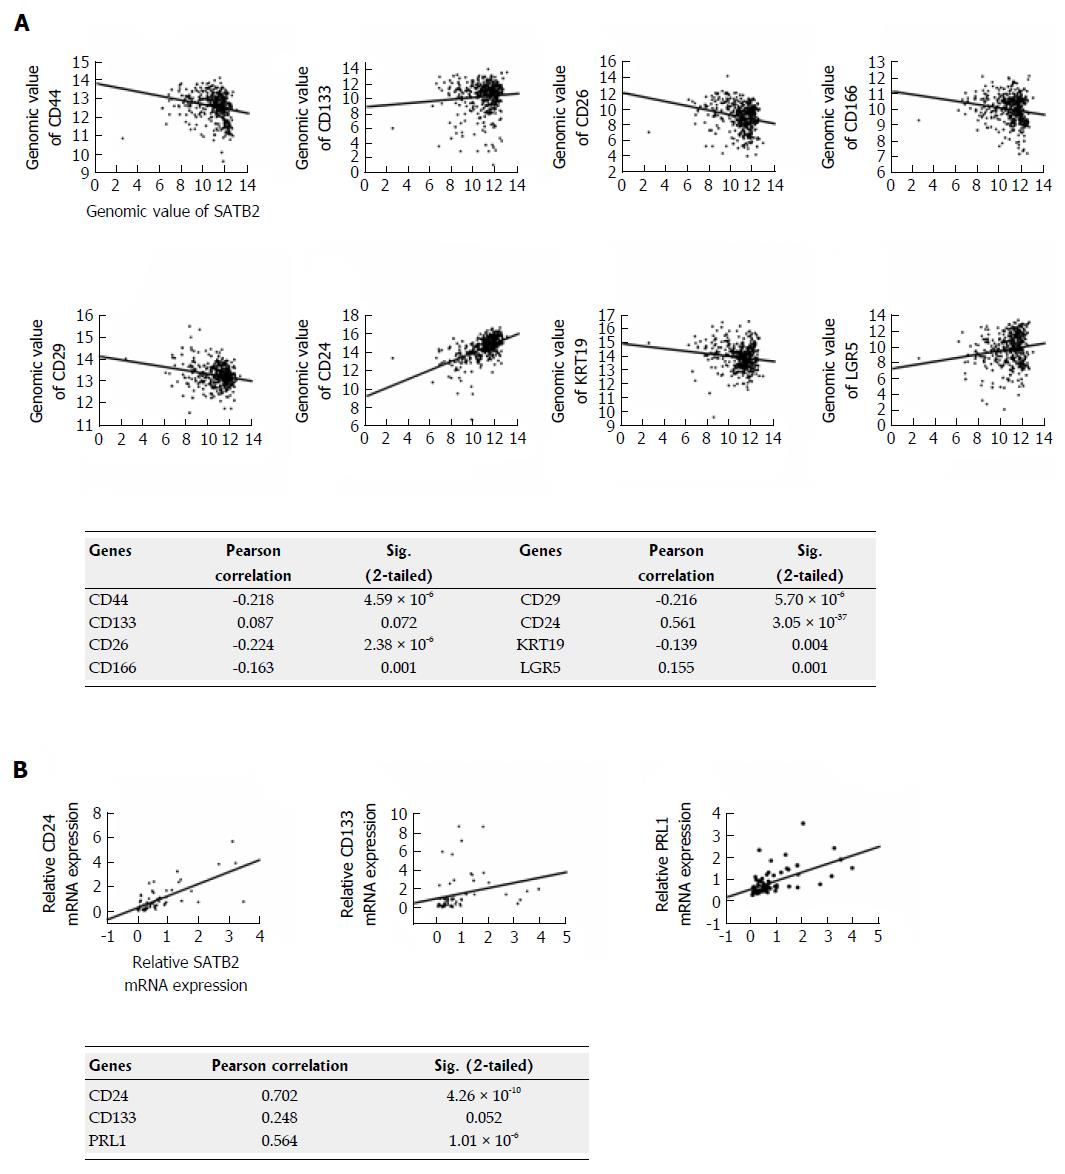
Figure 6 Special AT-rich sequence-binding protein 2 is correlated with some key stem cell markers including CD44 and CD24 in clinical tissues of colorectal cancer patients.
A: The correlations between SATB2 and stem cell markers were analyzed by Pearson correlation analysis according to RNA-Seq expression data of 434 primary colorectal tumors from TCGA. The matched scatter grams and the statistical P-values for different genes are showed separately; B: The correlations between SATB2 and stem cell markers were analyzed by Pearson correlation analysis according to the mRNA expression level of genes in 68 cases of colorectal cancer (CRC) tissues collected from NanFang hospital. The matched scatter grams and the statistical P-values for different genes are showed separately.
- Citation: Li Y, Liu YH, Hu YY, Chen L, Li JM. Special AT-rich sequence-binding protein 2 acts as a negative regulator of stemness in colorectal cancer cells. World J Gastroenterol 2016; 22(38): 8528-8539
- URL: https://www.wjgnet.com/1007-9327/full/v22/i38/8528.htm
- DOI: https://dx.doi.org/10.3748/wjg.v22.i38.8528


