Copyright
©The Author(s) 2016.
World J Gastroenterol. Oct 7, 2016; 22(37): 8361-8374
Published online Oct 7, 2016. doi: 10.3748/wjg.v22.i37.8361
Published online Oct 7, 2016. doi: 10.3748/wjg.v22.i37.8361
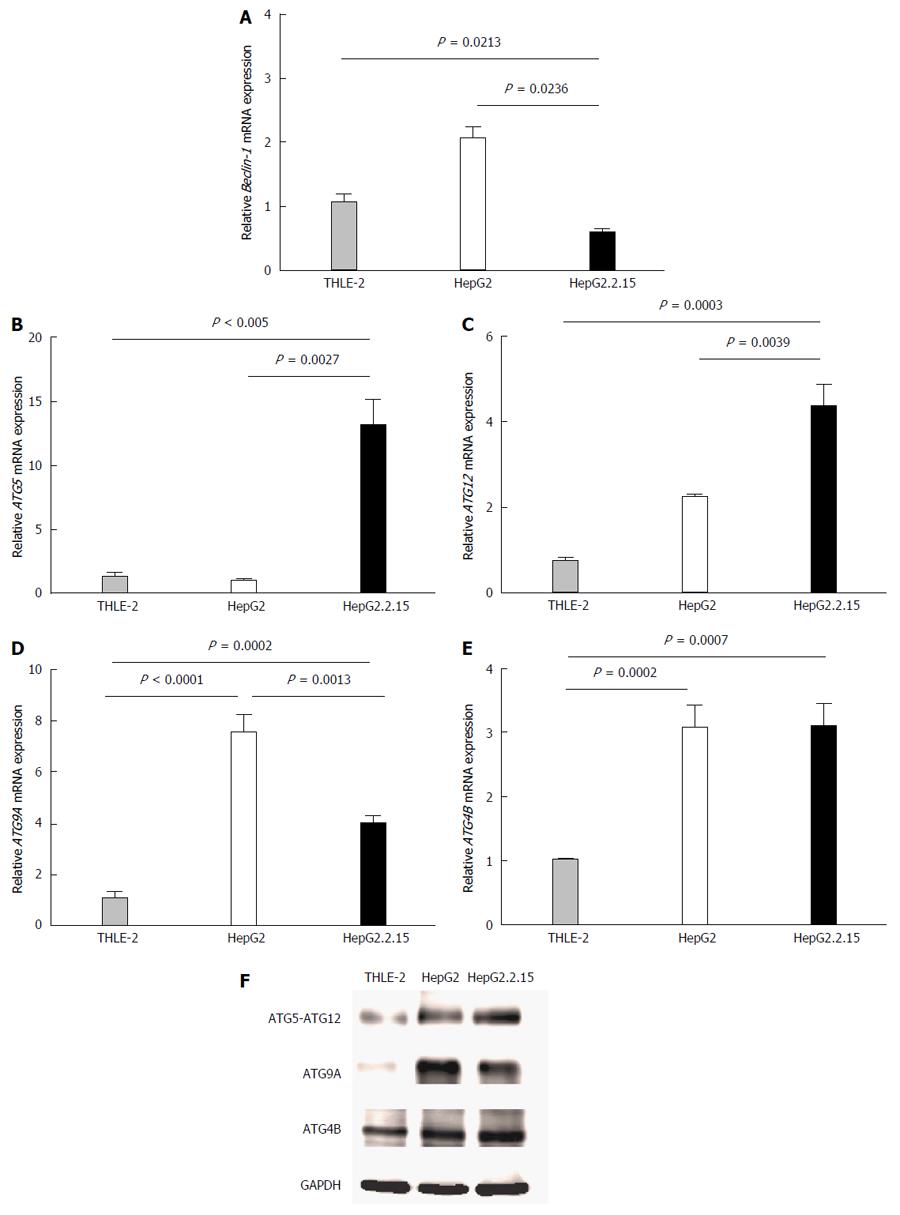
Figure 1 Quantitative real-time reverse transcriptase-polymerase chain reaction analysis of Beclin-1 (A), ATG5 (B), ATG12 (C), ATG9A (D) and ATG4B (E) mRNA in THLE-2, HepG2 and HepG2.
2.15 cell lines at 4 h post-culture in EBSS. β-actin was used as an internal control. Data represent the mean and SE from five independent experiments. Western blotting with specific antibodies was used to analyze ATG12, ATG9A and ATG4B protein expression in THLE-2, HepG2 and HepG2.2.15 cells at 4 h post-culture in EBSS (F). GAPDH was used as a protein loading control.
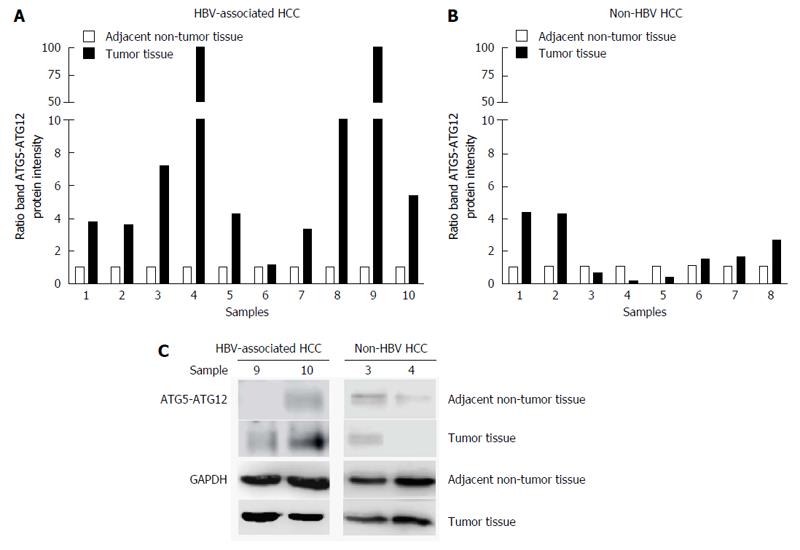
Figure 2 Quantification of ATG5-ATG12 protein levels from hepatitis B virus-infected hepatocellular carcinoma patients and non-hepatitis B virus hepatocellular carcinoma patients.
Western blotting with specific antibodies was used to analyze ATG12 protein expression in HBV-associated HCC and non-HBV HCC. GAPDH was used as a protein loading control. Graphs showing the intensity band ratio (tumor tissue/adjacent non-tumor tissue) quantified using the LI-COR® image system from western blot analysis were shown in A and B. Representative western blot results were shown in C. HBV: Hepatitis B virus; HCC: Hepatocellular carcinoma.
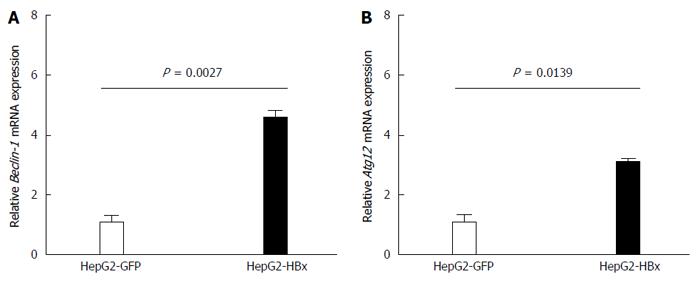
Figure 3 Quantitative real-time reverse transcriptase-polymerase chain reaction analysis of Beclin-1 (A) and ATG12 (B) mRNA expression in HepG2-GFP and HepG2-HBx transfected cell lines.
β-actin was used as an internal control. Data represent the mean and SE from three independent experiments.
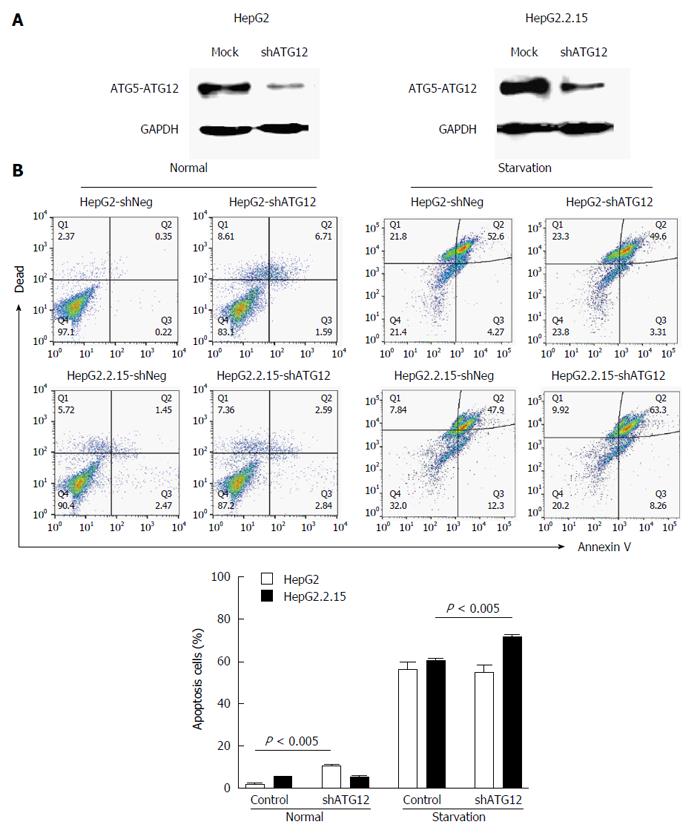
Figure 4 Apoptosis assays of HepG2 and HepG2.
2.15 cells transfected with shATG12 or shNeg (control). A: Suppression of ATG12 expression was done by RNA interference. Western blotting was used to analyze ATG12 proteins from mock treatment (control) and ATG12 knockdown (shATG12) in HepG2 and HepG2.2.15 cells; B: GAPDH was used as a protein loading control. Cells were transiently transfected with shRNA plasmids for 72 h (normal) and then cultured in EBSS for 4 h (starvation). Bar graphs show the percentage of total apoptotic cells detected by Annexin V binding. Data represent the mean and SE from three independent experiments.
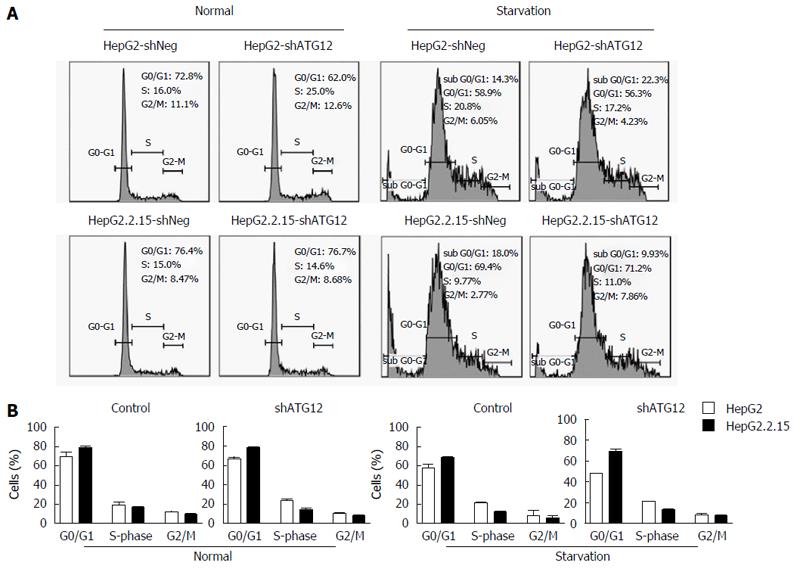
Figure 5 Cell cycle analysis of HepG2 and HepG2.
2.15 cells transfected with shATG12 or shNeg (control). A: Cells were transiently transfected with shRNA plasmids for 72 h (normal) and then cultured in EBSS for 4 h (starvation); B: Bar graphs show the percentage of cells in each phase. Data represent the mean and SE from three independent experiments.
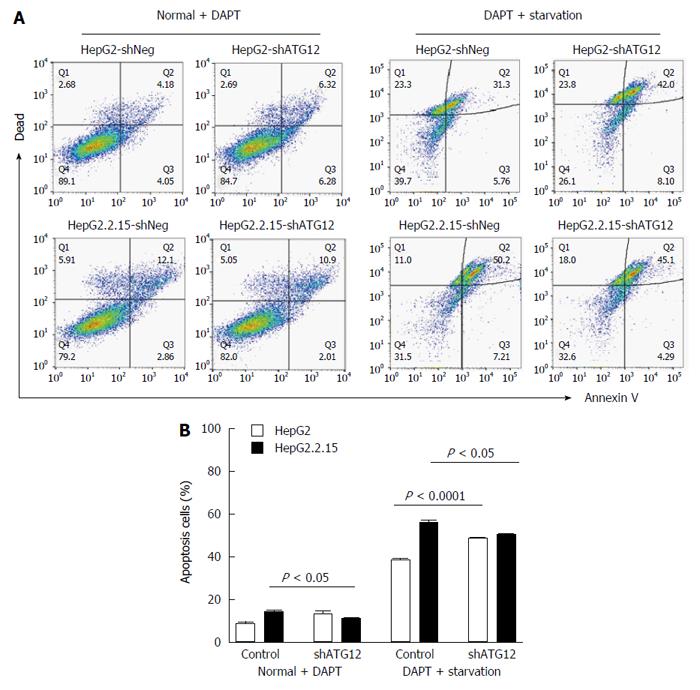
Figure 6 Apoptosis assays of HepG2 and HepG2.
2.15 cells transfected with shATG12 or shNeg (control) pretreated with DAPT. A: Cells were transiently transfected with shRNA plasmids for 24 h, and then pretreated with DAPT (50 μmol/L, 48 h) and cultured in EBSS for 4 h (starvation); B: Bar graphs show the percentage of total apoptotic cells detected by Annexin V binding. Data represent the mean and SE from three independent experiments.
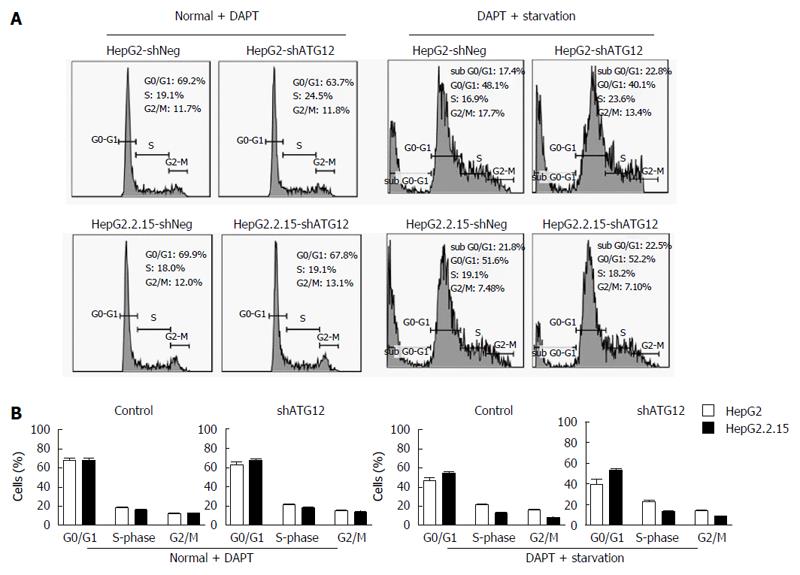
Figure 7 Cell cycle analysis of HepG2 and HepG2.
2.15 cells transfected with shATG12, ATG9A or shNeg (control) pretreated with DAPT. A: Cells were transfected with shRNA plasmids for 24 h, and then pretreated with DAPT (50 μmol/L, 48 h), and cultured in EBSS for 4 h (starvation); B: Bar graphs show the percentage of cells in each phase. Data represent the mean and SE from three independent experiments.
Figure 8 Quantitative real-time reverse transcriptase-polymerase chain reaction analysis of ATG12 mRNA in HepG2 and HepG2.
2.15 cells with DAPT treatment for 48 h. A: Data represent the mean and SE from three independent experiments; B: Notch activation was detected by cleaved Notch1 protein expression in HepG2 and HepG2.2.15 cells after silencing ATG12 for 72 h. GAPDH was used as a protein loading control.
- Citation: Kunanopparat A, Kimkong I, Palaga T, Tangkijvanich P, Sirichindakul B, Hirankarn N. Increased ATG5-ATG12 in hepatitis B virus-associated hepatocellular carcinoma and their role in apoptosis. World J Gastroenterol 2016; 22(37): 8361-8374
- URL: https://www.wjgnet.com/1007-9327/full/v22/i37/8361.htm
- DOI: https://dx.doi.org/10.3748/wjg.v22.i37.8361


