Copyright
©The Author(s) 2016.
World J Gastroenterol. Oct 7, 2016; 22(37): 8361-8374
Published online Oct 7, 2016. doi: 10.3748/wjg.v22.i37.8361
Published online Oct 7, 2016. doi: 10.3748/wjg.v22.i37.8361
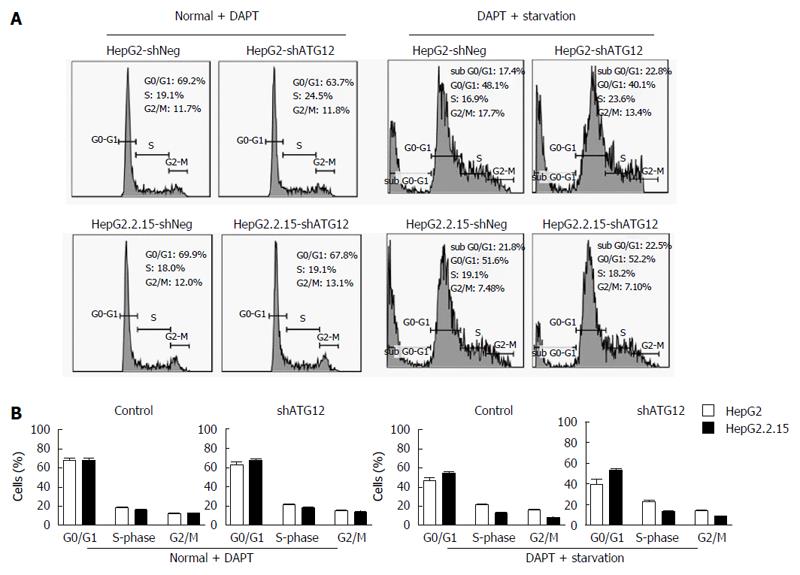
Figure 7 Cell cycle analysis of HepG2 and HepG2.
2.15 cells transfected with shATG12, ATG9A or shNeg (control) pretreated with DAPT. A: Cells were transfected with shRNA plasmids for 24 h, and then pretreated with DAPT (50 μmol/L, 48 h), and cultured in EBSS for 4 h (starvation); B: Bar graphs show the percentage of cells in each phase. Data represent the mean and SE from three independent experiments.
- Citation: Kunanopparat A, Kimkong I, Palaga T, Tangkijvanich P, Sirichindakul B, Hirankarn N. Increased ATG5-ATG12 in hepatitis B virus-associated hepatocellular carcinoma and their role in apoptosis. World J Gastroenterol 2016; 22(37): 8361-8374
- URL: https://www.wjgnet.com/1007-9327/full/v22/i37/8361.htm
- DOI: https://dx.doi.org/10.3748/wjg.v22.i37.8361


