Copyright
©The Author(s) 2016.
World J Gastroenterol. Oct 7, 2016; 22(37): 8349-8360
Published online Oct 7, 2016. doi: 10.3748/wjg.v22.i37.8349
Published online Oct 7, 2016. doi: 10.3748/wjg.v22.i37.8349
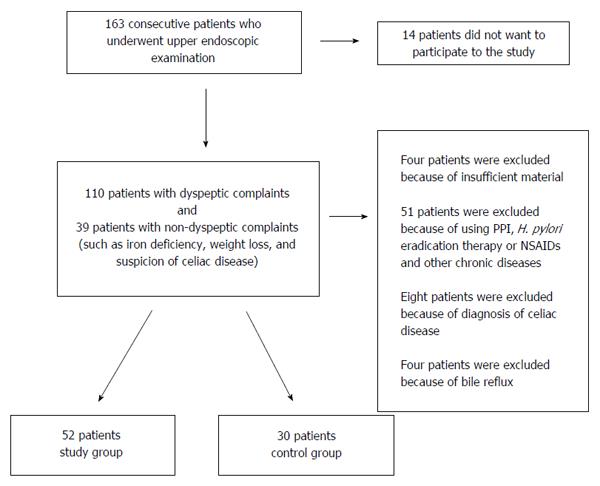
Figure 1 Patient recruitment flowchart.
PPI: Proton pump inhibitor; H. pylori: Helicobacter pylori.
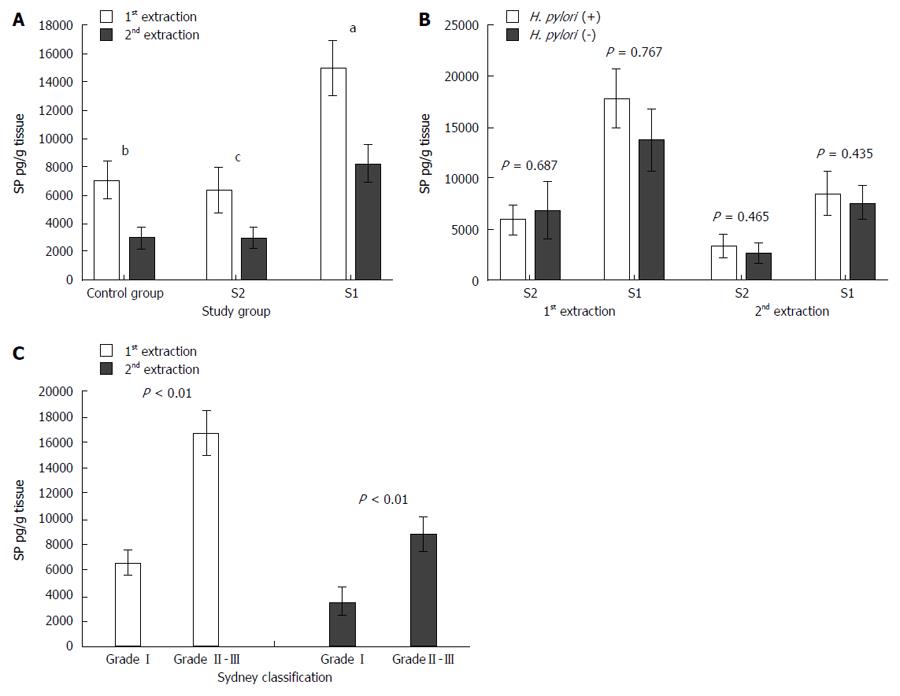
Figure 2 Substance P levels in the control (n = 30) and study (n = 52) groups.
A: Substance P (SP) levels were significantly higher in the gastric mucosa from sites with severe gastritis (S1) (a) than in the control group in both the first and second extractions (b) (P = 0.001 and 0.004, respectively). SP levels were significantly higher in S1 (a) sites than in areas with less severe gastritis (S2) (c) in both extractions (P = 0.006 and 0.001, respectively). However, there were no significant differences in the SP levels between the S1 and S2 samples in both the first and second extractions (P = 0.81 and 0.99, respectively); B: There were no significant differences in the SP levels between H. pylori (+) and H. pylori (-) patients; C: SP levels were significantly higher in patients with high-grade gastritis. H. pylori: Helicobacter pylori.
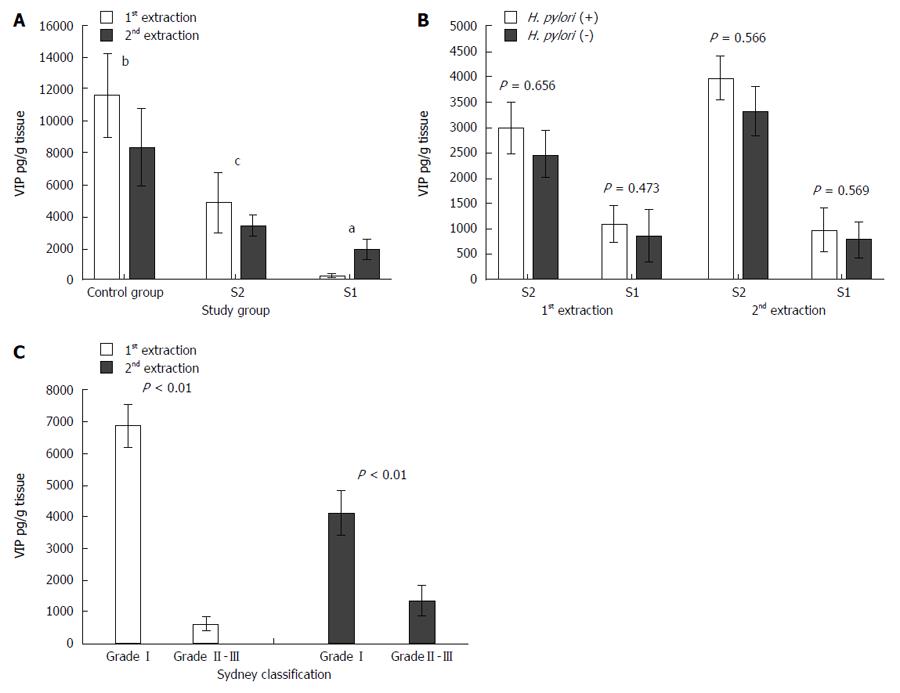
Figure 3 Vasoactive intestinal peptide levels in the control (n = 30) and study (n = 52) groups.
A: Vasoactive intestinal peptide (VIP) levels were significantly lower in the gastric mucosa from sites with severe (S1) and less severe (S2) gastritis than in the control group. (P = 0.0095, P = 0.0013, first extraction, respectively (a and b); P = 0.001, P = 0.030, second extraction, respectively (a and b)]. The VIP levels were significantly lower in S1 (a) samples than in S2 (c) samples in both the first and second extractions (P = 0.017 and P = 0.030, respectively); B: There were no significant differences in VIP levels between H. pylori (+) and H. pylori (-) patients; C: VIP levels were significantly higher in patients with low-grade gastritis. H. pylori: Helicobacter pylori.
Figure 4 Calcitonin gene-related peptide measurements in the control (n = 30) and study (n = 52) groups.
A: The calcitonin gene-related peptide (CGRP) levels were lower in the gastric mucosa from sites with severe (S1, b) and less severe (S2, a) gastritis than in the control group in the first and second extractions (P = 0.011, P = 0.031, first extraction, respectively; P = 0.002, P = 0.004, second extraction, respectively). Moreover, in the study group, CGRP levels were lower in S1 than in S2 samples in both the first and second extractions (P = 0.037 and P = 0.046, respectively); B: No significant differences in the CGRP levels were observed between H. pylori (+) and H. pylori (-) patients in the first and second extractions; C: CGRP levels were significantly higher in patients with low-grade gastritis. H. pylori: Helicobacter pylori.
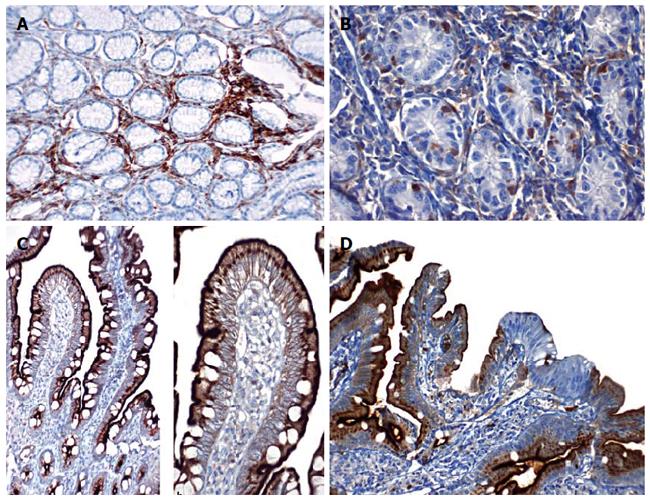
Figure 5 Gastric mucosa samples stained with CD10.
A: In patients with gastritis, diffuse CD10 positivity is shown in lymphocytes under the surface epithelium. Staining was not observed in the glandular epithelium (CD10, magnification × 200); B: CD10 positivity is shown in lymphocytes inside the epithelium of patients with gastritis. Staining was not observed in the glandular epithelium (CD10, magnification × 400); C: Intense positive staining is shown in the brush borders of the surface epithelium and supranuclear cytoplasm from healthy duodenal samples (CD10, magnification × 100 and 200); D: Loss of CD10 staining on the surface epithelium of duodenal samples from patients with duodenitis.
- Citation: Islek A, Yilmaz A, Elpek GO, Erin N. Childhood chronic gastritis and duodenitis: Role of altered sensory neuromediators. World J Gastroenterol 2016; 22(37): 8349-8360
- URL: https://www.wjgnet.com/1007-9327/full/v22/i37/8349.htm
- DOI: https://dx.doi.org/10.3748/wjg.v22.i37.8349


