Copyright
©The Author(s) 2016.
World J Gastroenterol. Sep 21, 2016; 22(35): 8060-8066
Published online Sep 21, 2016. doi: 10.3748/wjg.v22.i35.8060
Published online Sep 21, 2016. doi: 10.3748/wjg.v22.i35.8060
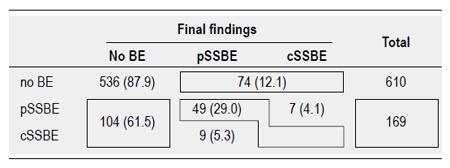
Figure 1 Patient distribution of Barrett esophagus change during the study period.
Data are expressed as absolute numbers (percentage). Disease free: n = 536; Persistence: n = 49; Appearance: n = 74; Progression: n = 7; Complete regression: n = 104; Partial regression: n = 9. BE: Barrett esophagus; pSSBE: Partial type short segment Barrett esophagus; cSSBE: Circumferential type Barrett esophagus.
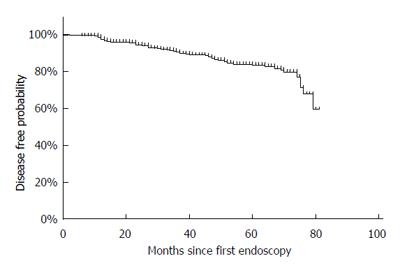
Figure 2 Kaplan-Meier curve illustrating disease free probability in patients with no short segment endoscopic Barrett esophagus at the first endoscopy.
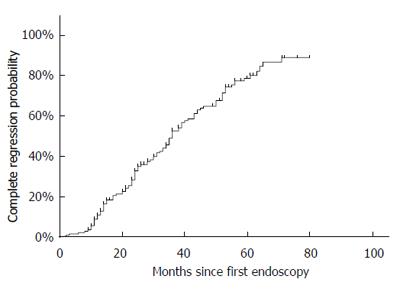
Figure 3 Kaplan-Meier curve illustrating complete regression probability in patients with short segment endoscopic Barrett esophagus at the first endoscopy.
- Citation: Shimoyama S, Ogawa T, Toma T. Trajectories of endoscopic Barrett esophagus: Chronological changes in a community-based cohort. World J Gastroenterol 2016; 22(35): 8060-8066
- URL: https://www.wjgnet.com/1007-9327/full/v22/i35/8060.htm
- DOI: https://dx.doi.org/10.3748/wjg.v22.i35.8060


