Copyright
©The Author(s) 2016.
World J Gastroenterol. Aug 28, 2016; 22(32): 7365-7372
Published online Aug 28, 2016. doi: 10.3748/wjg.v22.i32.7365
Published online Aug 28, 2016. doi: 10.3748/wjg.v22.i32.7365
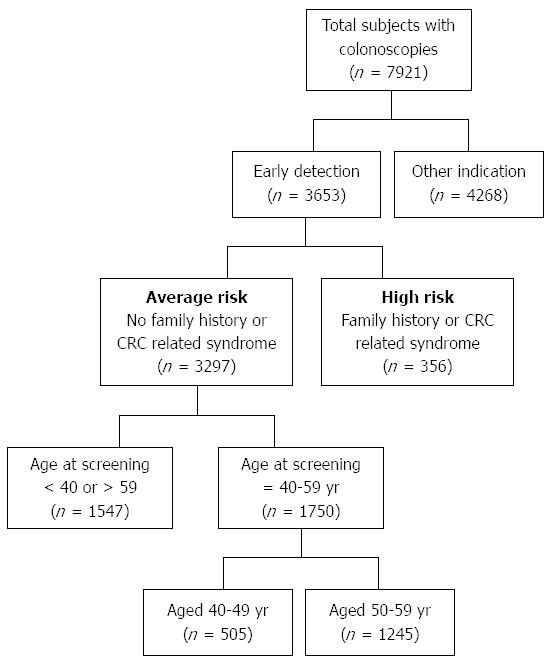
Figure 1 Flow chart for selection of study population.
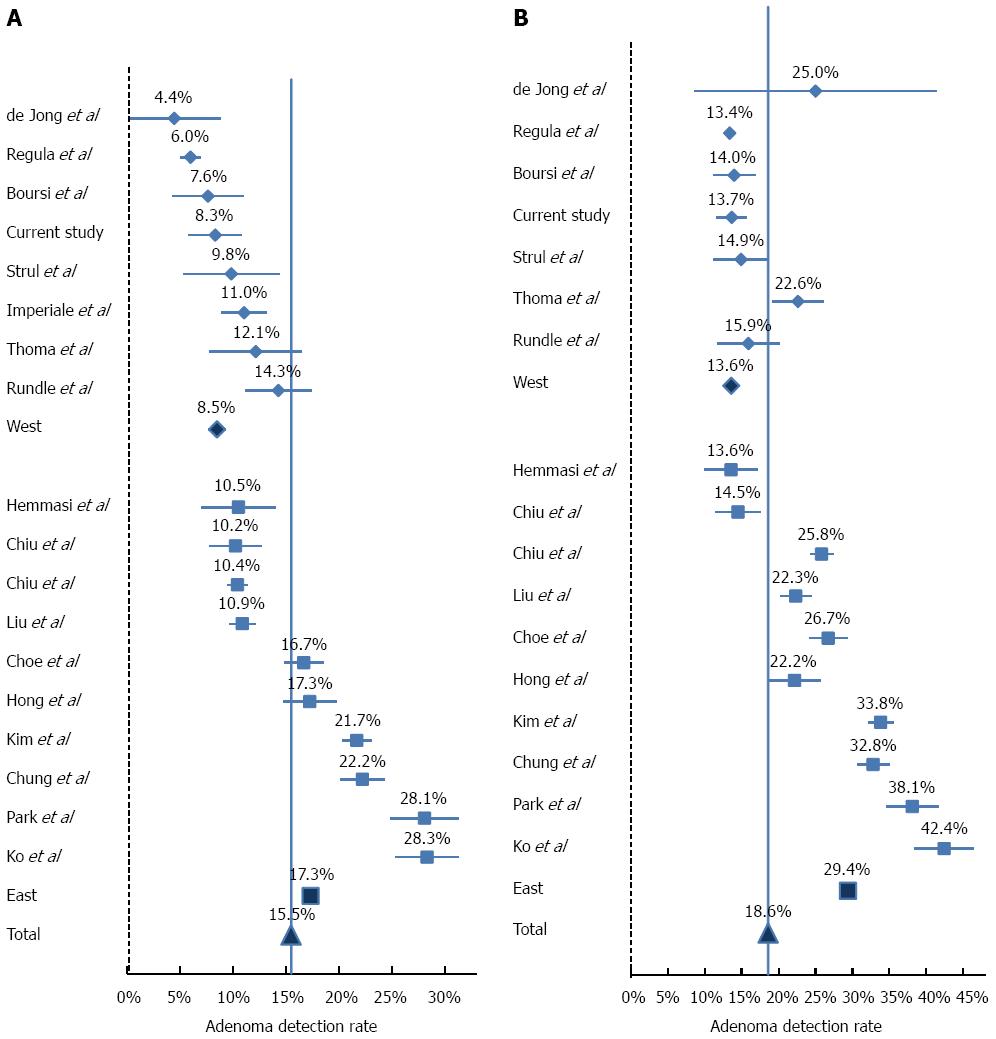
Figure 2 Overall adenoma detection rate in 40's (A) and 50's (B) age groups.
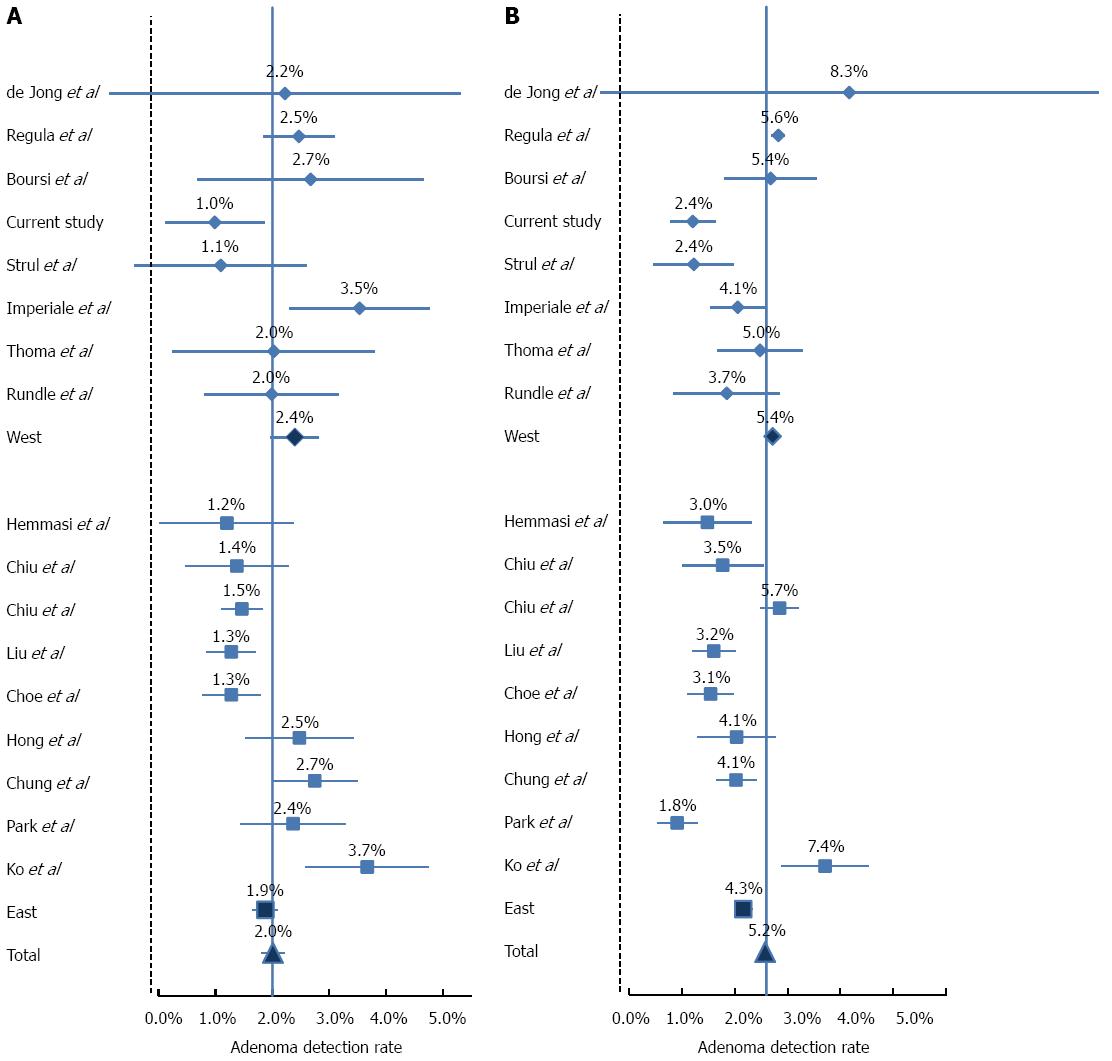
Figure 3 Advanced adenoma detection rate in 40's (A) and 50's (B) age groups.
- Citation: Leshno A, Moshkowitz M, David M, Galazan L, Neugut AI, Arber N, Santo E. Prevalence of colorectal neoplasms in young, average risk individuals: A turning tide between East and West. World J Gastroenterol 2016; 22(32): 7365-7372
- URL: https://www.wjgnet.com/1007-9327/full/v22/i32/7365.htm
- DOI: https://dx.doi.org/10.3748/wjg.v22.i32.7365


