Copyright
©The Author(s) 2016.
World J Gastroenterol. Aug 28, 2016; 22(32): 7342-7352
Published online Aug 28, 2016. doi: 10.3748/wjg.v22.i32.7342
Published online Aug 28, 2016. doi: 10.3748/wjg.v22.i32.7342
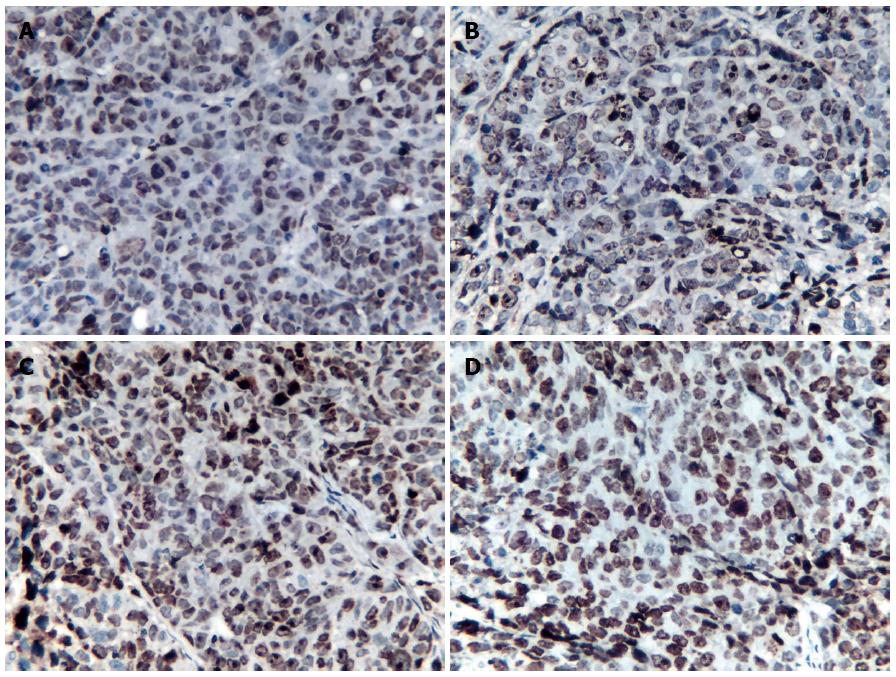
Figure 1 Tumor cell apoptosis.
Tumor cell apoptosis at 72 h (magnification × 400) in the control group (A), 5-FU group (B), rAd-p53 group (C) and rAd-p53 + 5-FU group (D).
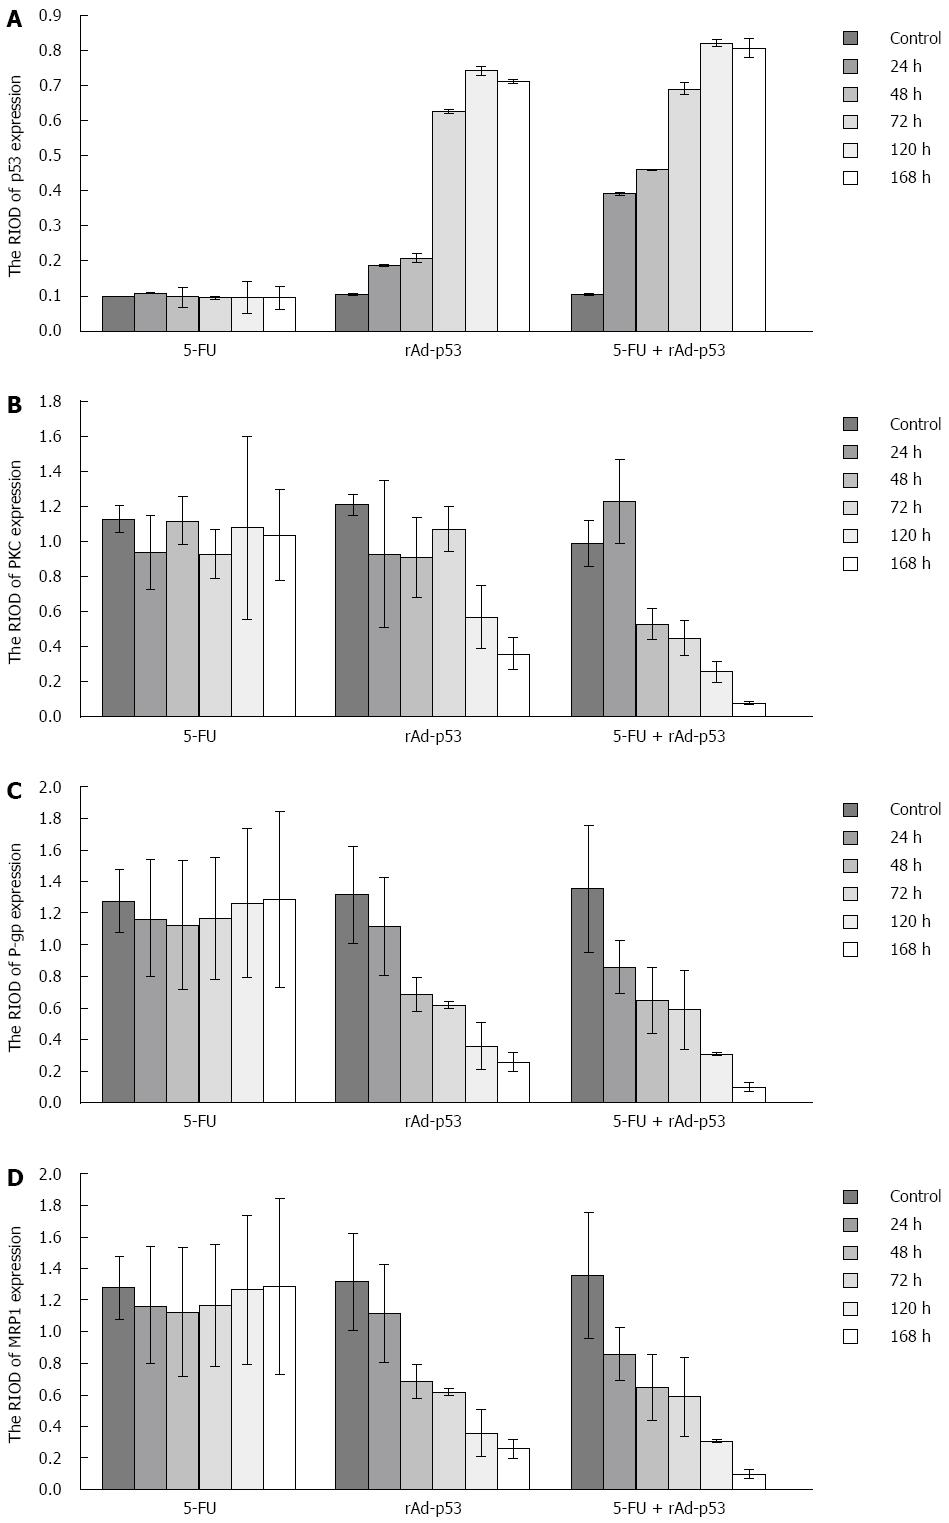
Figure 2 Relative band intensities of p53 expression (A), protein kinase C expression (B), permeability-glycoprotein expression (C) and MRP1 expression (D) in the three experimental groups.
- Citation: Xie Q, Wu MY, Zhang DX, Yang YM, Wang BS, Zhang J, Xu J, Zhong WD, Hu JN. Synergistic anticancer effect of exogenous wild-type p53 gene combined with 5-FU in human colon cancer resistant to 5-FU in vivo. World J Gastroenterol 2016; 22(32): 7342-7352
- URL: https://www.wjgnet.com/1007-9327/full/v22/i32/7342.htm
- DOI: https://dx.doi.org/10.3748/wjg.v22.i32.7342


