Copyright
©The Author(s) 2016.
World J Gastroenterol. Jul 21, 2016; 22(27): 6224-6234
Published online Jul 21, 2016. doi: 10.3748/wjg.v22.i27.6224
Published online Jul 21, 2016. doi: 10.3748/wjg.v22.i27.6224
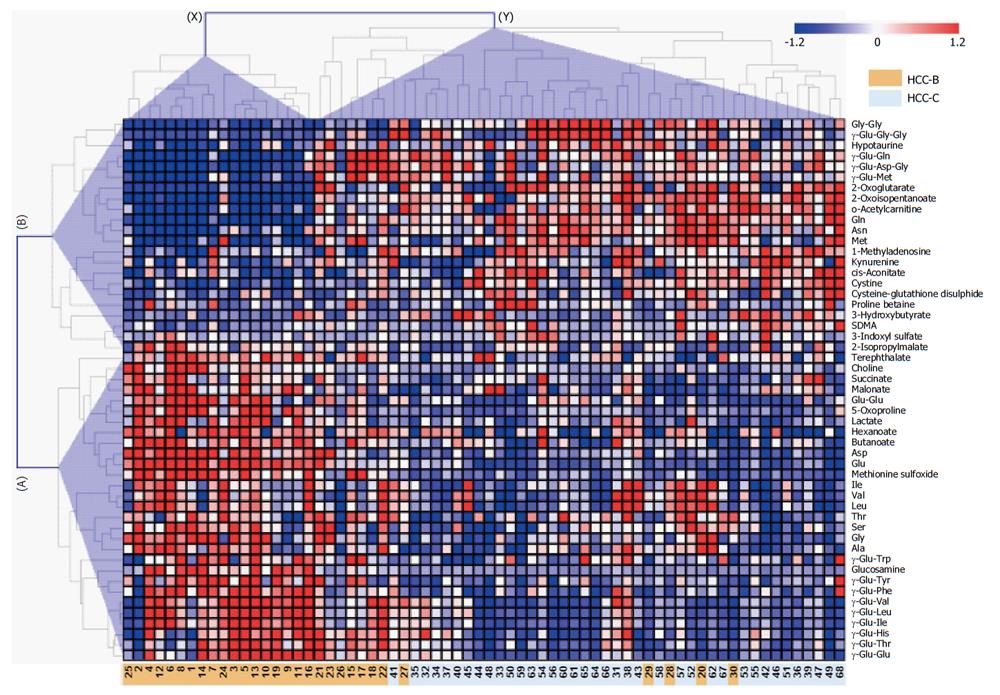
Figure 1 Heat map of quantified metabolites showing significant differences (P < 0.
05; Mann-Whitney test) between the hepatitis B virus-related hepatocellular carcinoma and hepatitis C virus-related hepatocellular carcinoma groups. The colors on the heat map were determined by the Z-score, reflecting the relative concentrations. The red, blue, and white colors indicate relatively higher, lower and average concentrations, respectively. The numbers at the bottom indicate the case number where orange and light blue indicate HCC-B and HCC-C, respectively. The clusters of metabolites and individuals are labeled A-B on the vertical axis and X–Y on the horizontal axis, respectively. HCC-B: Hepatitis B virus-related HCC; HCC-C: Hepatitis C virus-related HCC; HCC: Hepatocellular carcinoma.
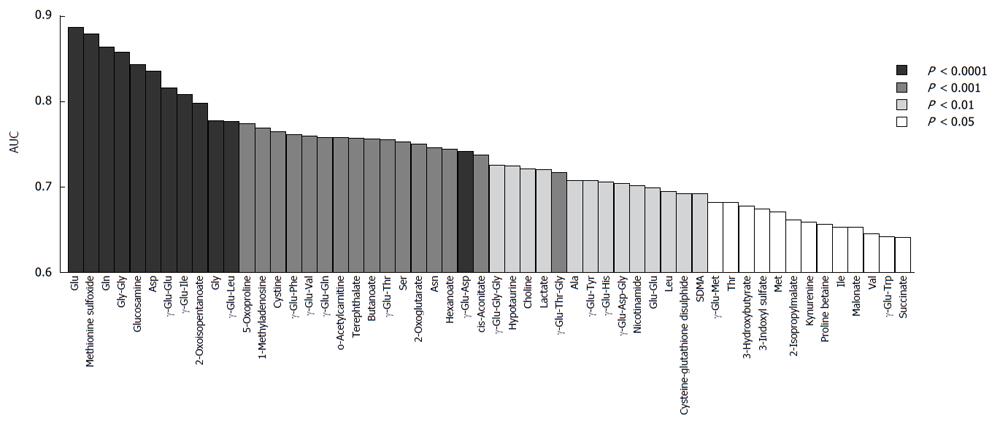
Figure 2 Area under the curve values of individual metabolites showing significant ability to discriminate (P < 0.
05) between hepatitis B virus-related hepatocellular carcinoma and hepatitis C virus-related hepatocellular carcinoma by receiver operating characteristic analysis. The color corresponds to the level of statistical significance. HCC-B: Hepatitis B virus-related HCC; HCC-C: Hepatitis C virus-related HCC; HCC: Hepatocellular carcinoma.
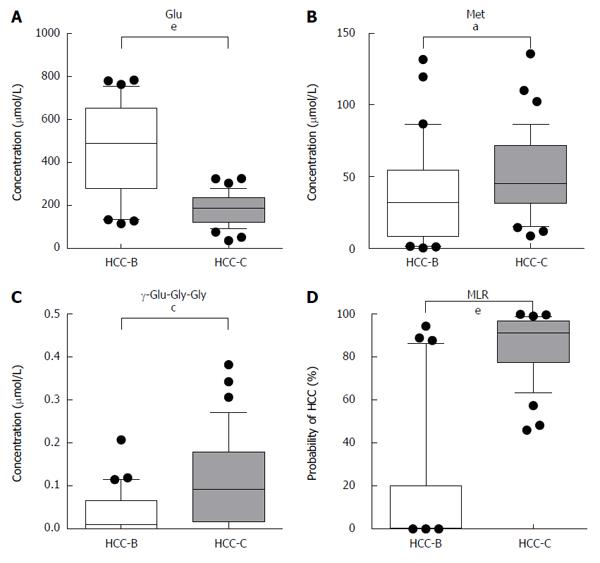
Figure 3 Serum concentrations of glutamic acid (A), methionine (B) and γ-glutamyl-glycine-glycine (C) in hepatitis B virus-related hepatocellular carcinoma and hepatitis C virus-related hepatocellular carcinoma.
The multiple logistic regression model using these three metabolites demonstrated that they had a significant ability to discriminate between HCC-B and HCC-C (D). aP < 0.05, cP < 0.01, eP < 0.0001 between groups. Glu: Glutamic acid; Met: Methionine; γ-Glu-Gly-Gly: γ-glutamyl-glycine-glycine; MLR: Multiple logistic regression; HCC-B: Hepatitis B virus-related HCC; HCC-C: Hepatitis C virus-related HCC; HCC: Hepatocellular carcinoma.
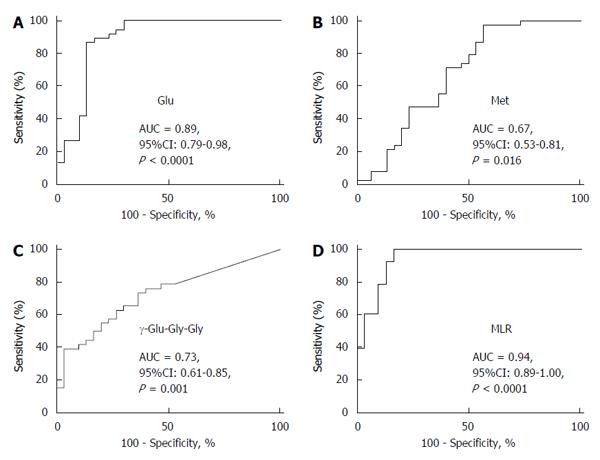
Figure 4 Area under the curve values for glutamic acid (A), methionine (B) and γ-glutamyl-glycine-glycine (C), and the multiple logistic regression model incorporating the concentrations of these three metabolites (D) for discriminating hepatitis B virus-related hepatocellular carcinoma from hepatitis C virus-related hepatocellular carcinoma by receiver operating characteristic analysis.
Glu: Glutamic acid; Met: Methionine; γ-Glu-Gly-Gly: γ-glutamyl-glycine-glycine; MLR: Multiple logistic regression; AUC: Area under the curve; HCC-B: Hepatitis B virus-related HCC; HCC-C: Hepatitis C virus-related HCC; HCC: Hepatocellular carcinoma.
- Citation: Saito T, Sugimoto M, Okumoto K, Haga H, Katsumi T, Mizuno K, Nishina T, Sato S, Igarashi K, Maki H, Tomita M, Ueno Y, Soga T. Serum metabolome profiles characterized by patients with hepatocellular carcinoma associated with hepatitis B and C. World J Gastroenterol 2016; 22(27): 6224-6234
- URL: https://www.wjgnet.com/1007-9327/full/v22/i27/6224.htm
- DOI: https://dx.doi.org/10.3748/wjg.v22.i27.6224


