Copyright
©The Author(s) 2016.
World J Gastroenterol. Jul 21, 2016; 22(27): 6145-6172
Published online Jul 21, 2016. doi: 10.3748/wjg.v22.i27.6145
Published online Jul 21, 2016. doi: 10.3748/wjg.v22.i27.6145
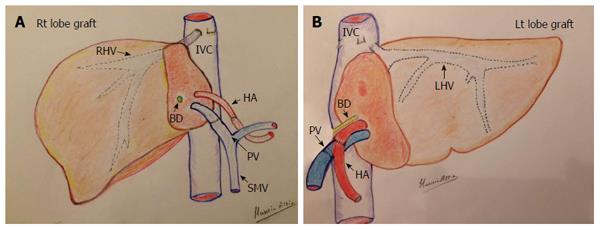
Figure 1 Diagram of the surgical technique of graft implantation in living donor liver transplantation.
A: Right lobe graft in an adult patient; B: Left lobe lateral segment in a child. HA: Hepatic artery; PV: Portal vein; IVC: Inferior vena cava; BD: Bile duct; SMV: Superior mesenteric vein; RHV: Right hepatic vein; LHV: Left hepatic vein.
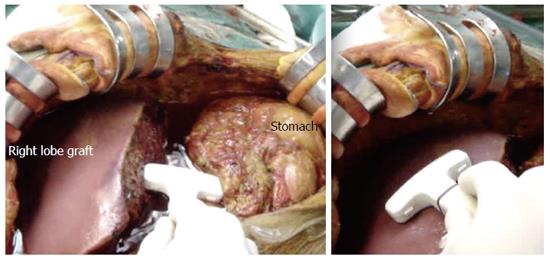
Figure 2 Photography showing the technique of intraoperative ultrasound.
The upper abdominal cavity is filled with warm saline and a T-shaped 7-9 MHz linear transducer is applied at the graft hilum and graft surface.
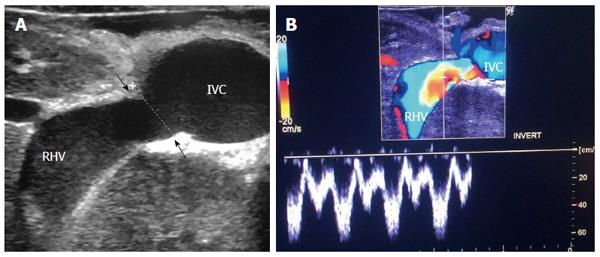
Figure 3 Intra-operative ultrasound evaluation of right hepatic vein anastomosis.
A: B-mode US image showing RHV with end-to-side anastomosis with the IVC; B: Color Doppler image showing normal triphasic waveform of the RHV. RHV: Right hepatic vein; IVC: Inferior vena cava.
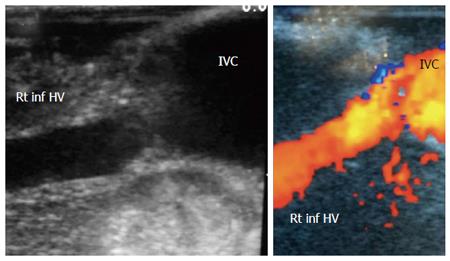
Figure 4 Intra-operative ultrasound evaluation of right inferior hepatic vein anastomosis.
B-mode and color US image showing the anastomosis of accessory right inferior HV, end-to-side with the IVC. Rt inf HV: Right inferior hepatic vein; IVC: Inferior vena cava.
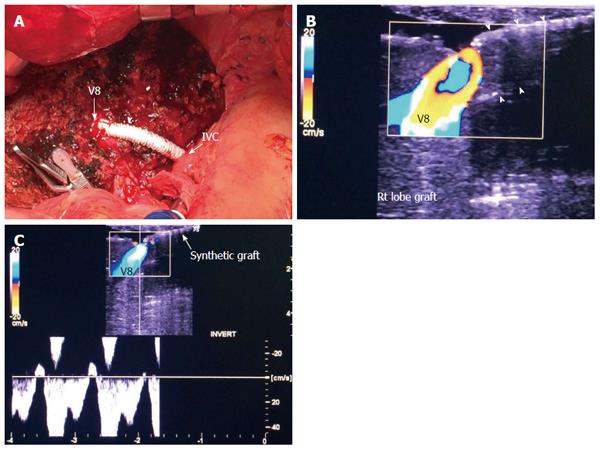
Figure 5 Intra-operative ultrasound evaluation of segment VIII synthetic graft.
A: Photography showing the synthetic graft (arrow head) between V8 and IVC; B: Color image showing patent segment VIII vein and absence of color flow in the synthetic graft (arrow heads); C: Color Doppler image showing normal triphasic waveform in segment VIII vein, confirming synthetic graft patency. V8: Segment VIII hepatic vein; IVC: Inferior vena cava.
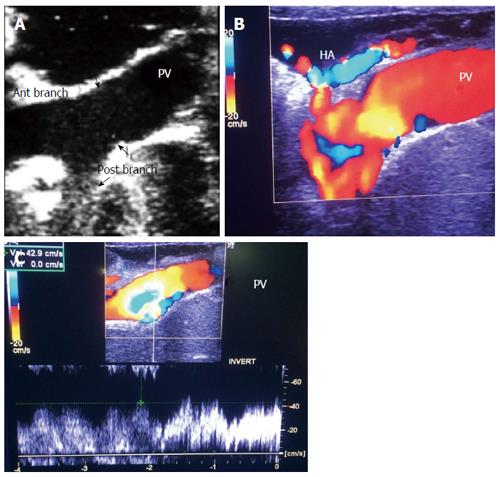
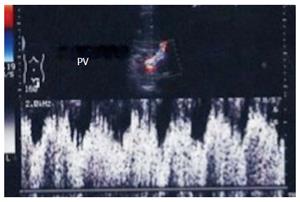
Figure 6 Intra-operative ultrasound evaluation of portal vein anastomosis.
A: B-mode ultrasound image showing the extrahepatic portal vein and intrahepatic bifurcation. The suture line appears as echogenic shadows at the site of anastomosis (arrows); B: Color image showing homogeneous color saturation in the PV with mild aliasing at site of anastomosis and at the PV bifurcation; C: Color Doppler image showing antegrade normal pulsatile flow in the PV. PV: Portal vein; HA: Hepatic artery.
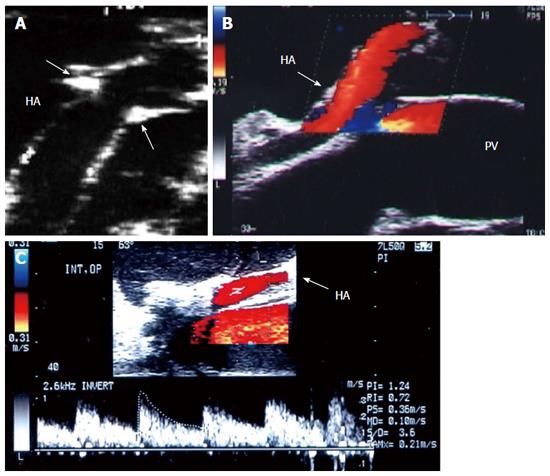
Figure 7 Intra-operative ultrasound evaluation of hepatic artery anastomosis.
A: B-mode ultrasound image showing the HA anastomosis, appearing as an echogenic shadows at the site of anastomosis (arrows); B: Color image showing homogeneous color saturation in the HA (arrow); C: Color Doppler image showing normal biphasic waveform of the HA (arrow). PV: Portal vein; HA: Hepatic artery.
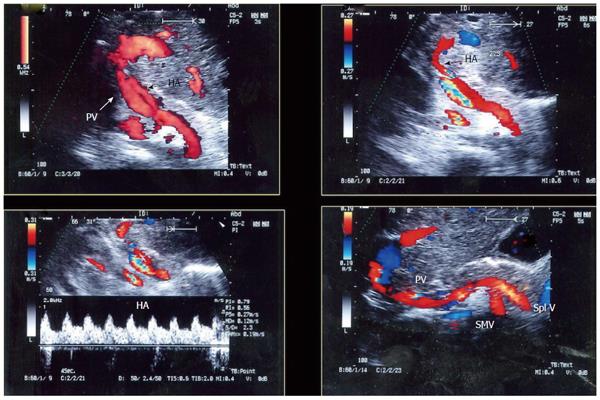
Figure 8 Intra-operative ultrasound evaluation of the portal vein and hepatic artery in left lobe transplants.
Color Doppler images showing the PV and HA anastomoses. Note the C-shaped entry of the vessels at the graft hilum. PV: Portal vein; HA: Hepatic artery.
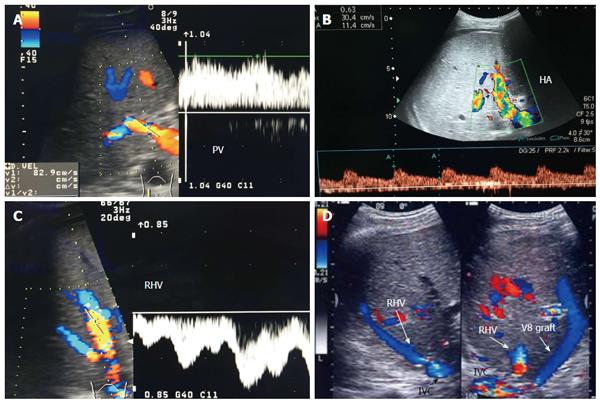
Figure 9 Post-operative Doppler ultrasound evaluation of the graft vasculature.
A: Color Doppler image demonstrating normal petal, slightly turbulent, high flow in the PV (83 cm/s); B: Color Doppler image showing normal biphasic flow in the HA with normal RI = 0.63; C: Color Doppler image showing normal triphasic flow in the RHV; D: Color US image showing patent autologous V8 graft. PV: Portal vein; HA: Hepatic artery; IVC: Inferior vena cava; RHV: Right hepatic vein; V8: Segment VIII vein.
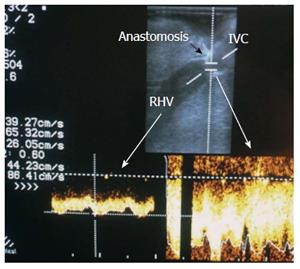
Figure 10 Normal right hepatic vein anastomosis.
Intra-operative color Doppler image demonstrating normal augmentation of the RHV flow at the site of anastomosis (2-fold) compared to the intrahepatic flow, with preserved phasic flow pattern. IVC: Inferior vena cava; RHV: Right hepatic vein.
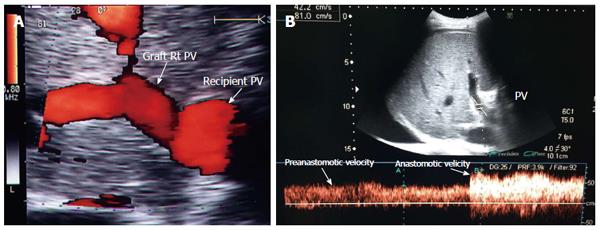
Figure 11 Portal vein size mismatch in right lobe grafts.
A: Post-operative color ultrasound image showing size mismatch between the recipient and donor PVs, a frequent finding in right lobe living donor liver transplantation; B: Color Doppler image showing anastomotic augmentation of the PV velocity (2-fold) compared to the pre-anastomotic velocity (accepted finding in the presence of size mismatch). PV: Portal vein.
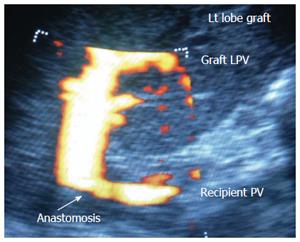
Figure 12 Portal vein size mismatch in left lobe grafts.
Color ultrasound image showing significant size mismatch between the small recipient PV and the graft left PV in pediatric living donor liver transplantation. PV: Portal vein; LPV: Left portal vein.
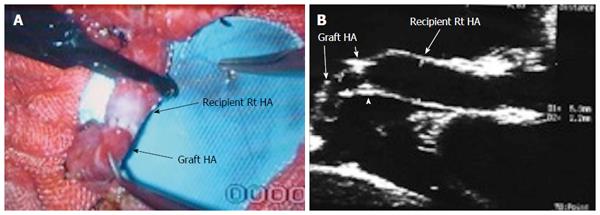
Figure 13 Hepatic artery size mismatch.
A: Photograph showing size mismatch between the recipient and donor HAs during right lobe living donor liver transplantation; B: B-mode US image showing hypertrophied recipient HA and small graft HA with good anastomosis (arrow heads). HA: Hepatic artery.
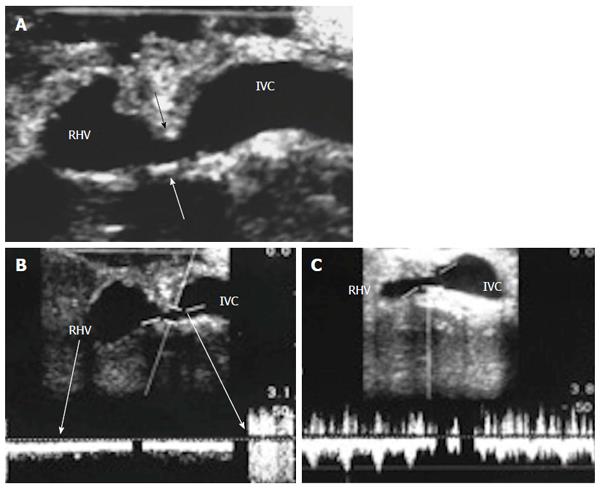
Figure 14 Intra-operative hepatic vein stenosis.
A: Intra-operative B-mode US image showing tight stricture along the RHV anastomosis with the IVC (arrows); B: Pulsed Doppler image showing dampened intra-hepatic venous spectral flow, loss of the normal venous phasicity and anastomotic jet (> 3-fold) compared to the intrahepatic flow; C: Pulsed Doppler image after surgical revision of the RHV anastomosis demonstrating improvement of the flow with regaining the triphasic pattern respecting the cardiac cycle. RHV: Right hepatic vein; IVC: Inferior vena cava.
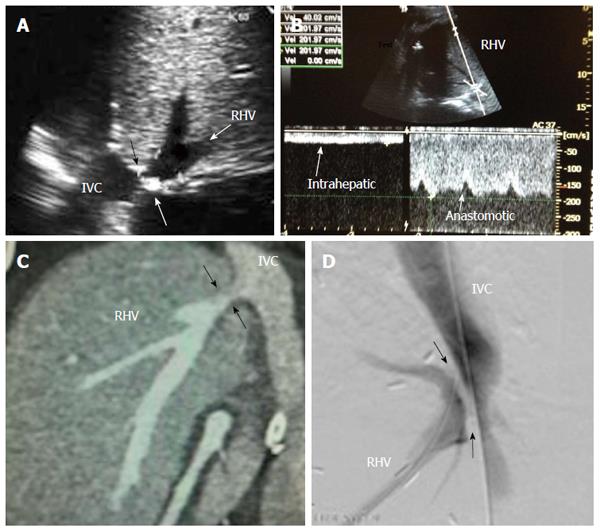
Figure 15 Post-operative hepatic vein stenosis in a patient with persistent ascites and graft dysfunction, 2 mo post-living donor liver transplantation.
A: Post-operative B-mode US image showing tight stricture along the RHV anastomosis with the IVC (arrows); B: Pulsed Doppler image showing dampened hepatic venous spectral flow, loss of normal hepatic venous phasicity and anastomotic jet (5-fold) compared to the intrahepatic flow; C: MDCT angiography, coronal reconstructed image showing RHV anastomotic stricture (arrows); D: Digital subtraction trans-hepatic venography showing significant RHV anastomotic stricture (arrows), The pressure gradient was > 10 mmHg across the anastomosis. Balloon angioplasty and stent placement were performed. RHV: Right hepatic vein; IVC: Inferior vena cava.
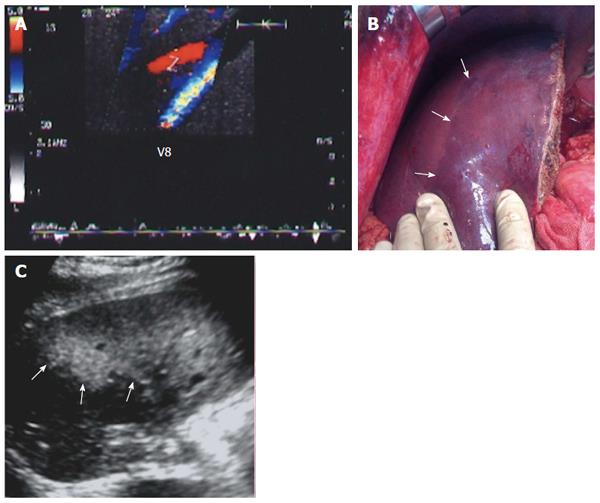
Figure 16 Graft congestion secondary to segment VIII vein ligation.
A: Intra-operative color Doppler image showing stagnant (to-and fro flow) within a ligated V8 (normal intraoperative finding); B: Photography showing geographical areas of discoloration (congestion) along the anterior segments of the graft (arrows); C: Postoperative US image of the same patient 2 d post-operative demonstrating large, echogenic, geographical areas of congestion along the anterior segments of the graft (arrows). Associated graft dysfunction was present. V8: Segment VIII vein.
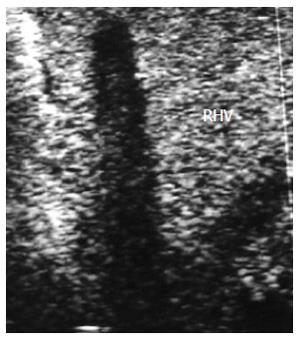
Figure 17 Intra-operative right hepatic vein thrombosis.
B-mode, IOUS image showing echogenic shadows and total thrombosis of the RHV. Surgical correction was futile. RHV: Right hepatic vein.
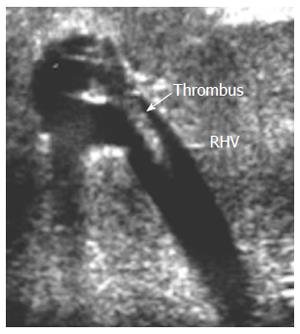
Figure 18 Intra-operative right hepatic vein partial thrombosis.
B-mode, IOUS image showing small adherent thrombus near the RHV anastomosis without impeding the blood flow, and was managed conservatively. RHV: Right hepatic vein.
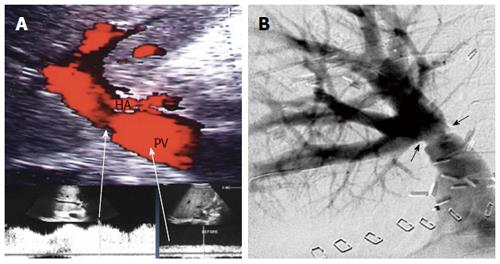
Figure 19 Portal vein pseudo-stenosis in a clinically silent patient.
A: Post- operative color Doppler image, 2 mo post living donor liver transplantation demonstrating anastomotic stenosis 50%-60%, with elevation of the anastomotic velocity (4-fold) compared to the pre-anastomotic velocity; B: Percutaneous trans-hepatic digital subtraction portography image, showing anastomotic stricture (arrows) however, the pressure gradient across the anastomosis was 3 mmHg and angioplasty and stent placement were not performed. PV: Portal vein; HA: Hepatic artery.
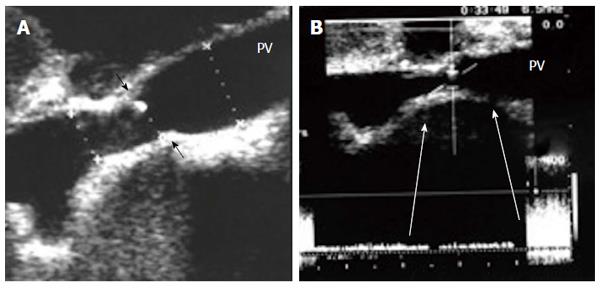
Figure 20 Intra-operative portal vein stenosis.
A: B-mode US image showing PV anastomotic stricture; the suture line is seen encroaching on the lumen (arrows) with high level echoes seen at the site of anastomosis, representing turbulence of flow; B: Pulsed Doppler image demonstrating anastomotic elevation of the PV velocity (6-fold) compared to the pre-anastomotic velocity. The pressure gradient across the anastomosis was 8 mmHg, indicating the need for surgical anastomotic revision. PV: Portal vein.
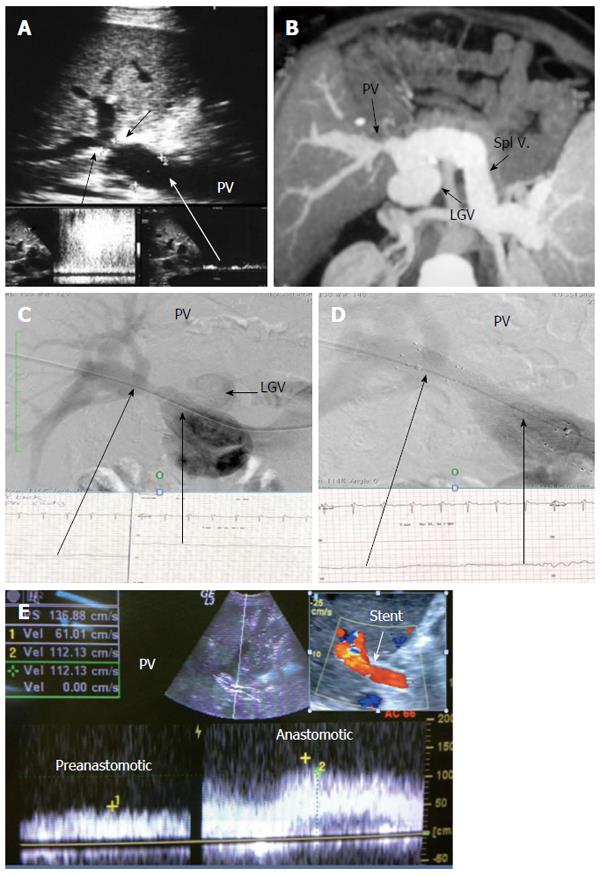
Figure 21 Post-operative developmental portal vein stenosis in a patient with attack of variceal bleeding, 1-year post-living donor liver transplantation.
A: B-mode and pulsed Doppler image showing tight PV anastomotic stricture (arrows) and anastomotic jet (> 10-fold) compared to the pre-anastomotic velocity; B: MSCT angiography image demonstrating tight PV anastomotic stricture with aneurysmal dilatation of the left gastric vein; C: Percutaneous trans-hepatic portography demonstrating tight PV stricture and dilated left gastric vein, stealing the portal flow. The pressure gradient was 10 mmHg; D: Control portography after balloon dilatation and stent placement demonstrating wide anastomosis, normalization of the pressure gradient, improvement of the flow steal and disappearance of the left gastric vein filling; E: Color Doppler image after PV stent placement confirming improved portal flow with increased pre-anastomotic velocity and mild elevation of the anastomotic velocity. PV: Portal vein; LGV: Left gastric vein.
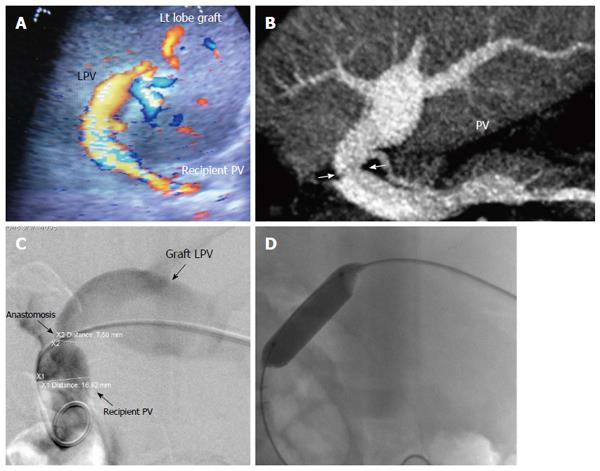
Figure 22 Post-operative developmental portal vein stenosis in a 16-year-old boy with progressive splenomegaly and pancytopenia, 1-year post-left lobe living donor liver transplantation.
A: Color US image showing PV anastomotic stricture and post-stenotic dilatation. The anastomotic velocity elevation was borderline (3-4-fold) compared to the pre-anastomotic velocity (not shown); B: Multi-slice CT angiography, reconstructed image, demonstrating moderate PV anastomotic stricture with post stenotic dilatation of the graft PV; C: Percutaneous trans-hepatic digital subtraction portography image, demonstrating moderate PV anastomotic stricture (> 50 %) with post-stenotic dilatation. The pressure gradient was 7 mmHg; D: X-ray image during balloon dilatation of the stricture. The pressure gradient was normalized and stent placement was not performed. PV: Portal vein; LPV: Left portal vein.
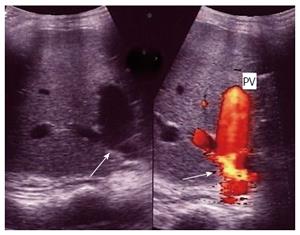
Figure 23 Post-operative developmental portal vein stenosis 2-years post-living donor liver transplantation.
B-mode and color US image demonstrating tight PV anastomotic stricture with color aliasing (arrows) and aneurysmal dilatation of the PV anterior segmental branch. PV: Portal vein.
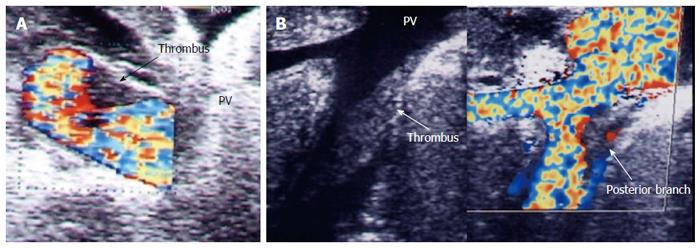
Figure 24 Intra-operative portal vein thrombosis.
A: Intra-operative color US image showing a small adherent thrombus to the PV wall, persisting after thrombectomy for old subtotal PV thrombosis. There was good portal flow and was managed conservatively; B; Intra-operative B-mode and color US image of another patient showing acute thrombus adherent to the PV posterior segmental branch inside the graft. Thrombectomy failed to extract the thrombus and was managed conservatively. PV: Portal vein.
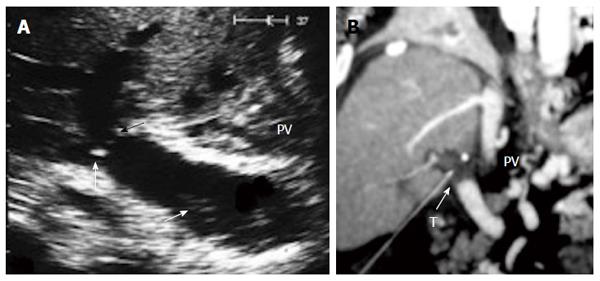
Figure 25 Post-operative portal vein thrombosis, 1 wk post-living donor liver transplantation.
A: B-mode US image showing faintly echogenic thrombus in the recipient PV (arrow) and PV anastomotic stricture (arrow heads); B: Multi-slice CT angiography, coronal reconstructed image after 2 h, demonstrating total PV thrombosis (arrow). The patient underwent thrombectomy and anastomotic revision. PV: Portal vein; T: Thrombus.
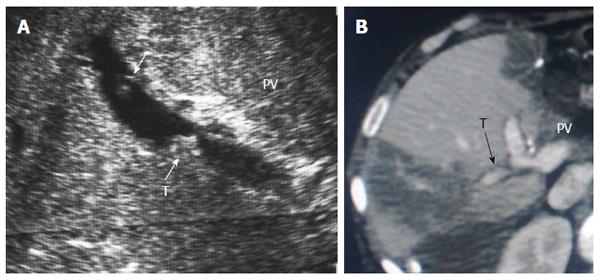
Figure 26 Post-operative portal vein segmental branch thrombosis and subsequent graft infarction, 2 wk post-living donor liver transplantation.
A: B-mode US image showing multiple acute thrombi in the posterior segmental branch of the PV; B: Triphasic portal venous CT contrast study, demonstrating attenuated posterior branch of the PV with filling thrombus defect (arrow). Segmental portal infarction appears as wedge-shaped area of hypo-perfusion. PV: Portal vein; T: Thrombus.
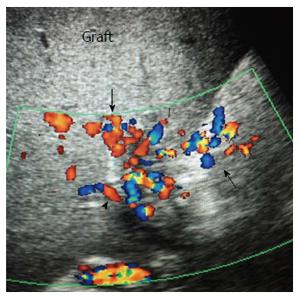
Figure 27 Chronic post-operative portal vein thrombosis, 2-years post-living donor liver transplantation.
Color US image showing numerous dilated collateral venous channels at the graft hilum (arrows) and non-visualized main graft portal vein.
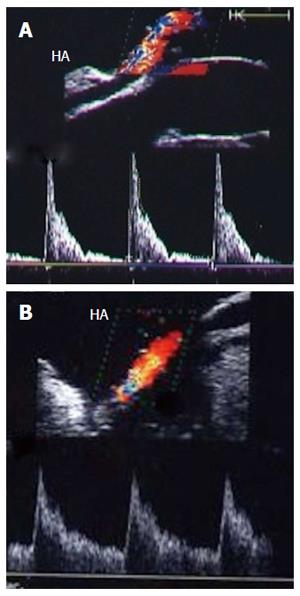
Figure 28 Intra-operative hepatic artery vasospasm.
A: Intra-operative Doppler US image showing high resistance flow in the HA with low diastolic flow and normal systolic upstroke; B: Doppler US image of the HA after intra-operative papaverine installation showing relief of spasm, regaining the normal biphasic Doppler waveform, and a continuous diastolic flow throughout the cardiac cycle. HA: Hepatic artery.
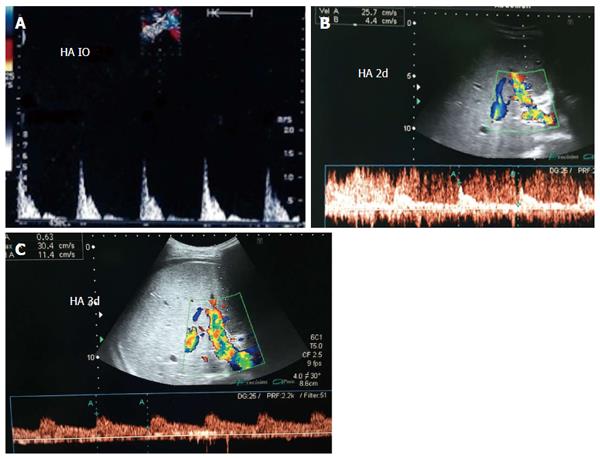
Figure 29 Intra- and post-operative hepatic artery vasospasm.
A: Intraoperative Doppler US image showing high resistance of the HA with damped diastolic flow and normal systolic upstroke; B and C: Doppler US images of the HA, 2 d and 3 d post-operative after systemic administration of vasodilators, showing improvement of the diastolic flow and correction of the normal biphasic Doppler waveform. HA: Hepatic artery; IO: Intra-operative.
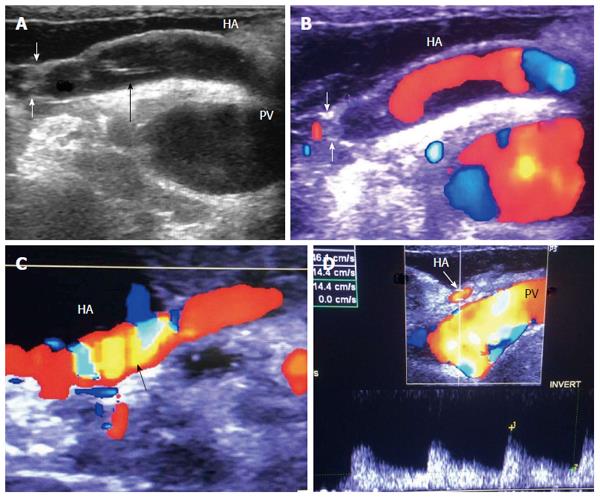
Figure 30 Intra-operative hepatic artery dissection and thrombosis.
A: IOUS B-mode image, showing HA anastomotic stricture (White arrows) and a dissecting flap at the recipient side of the artery (black arrow); B: Color image showing abrupt occlusion of the HA proximal to the anastomosis and acute thrombosis at the site of anastomosis; C: Color image after revision of the anastomosis, showing patent artery with color aliasing at the region of the anastomosis (arrow); D: Color Doppler image, showing normal biphasic arterial flow distal to the anastomosis. HA: Hepatic artery; PV: Portal vein.
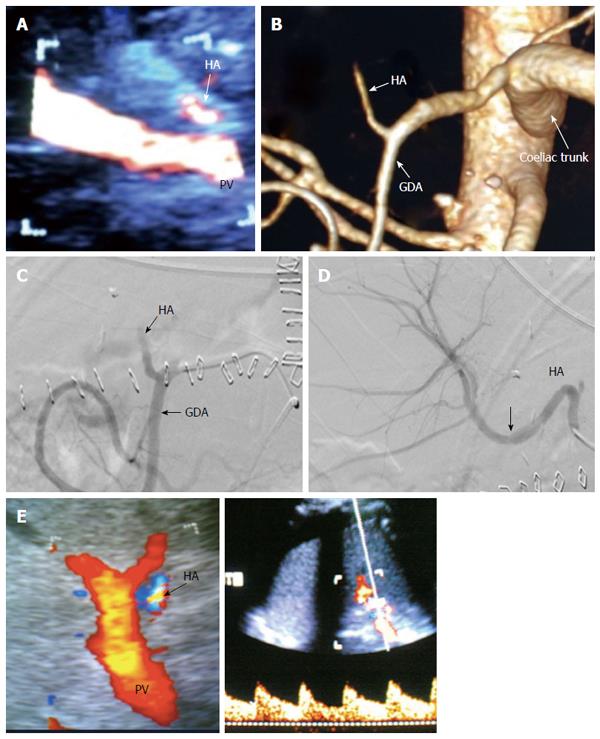
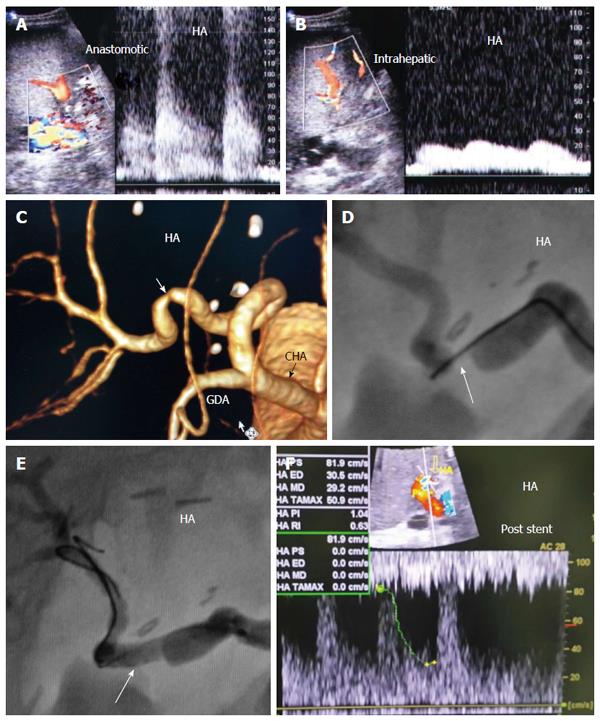
Figure 31 Post-operative hepatic artery thrombosis 4 d post-living donor liver transplantation in a patient with shooting liver enzymes.
A: Color US image, showing abrupt occlusion of the HA at the graft hilum (arrow) and absence of intra-hepatic flow; B: MDCT angiography, volume rendering image, showing complete occlusion of the HA proximal to the anastomosis and non-filling of the intra-hepatic branches (arrow); C: Digital subtraction angiography image, confirming complete thrombosis of the HA proper (arrow); D: Control angiography after thrombolysis with tissue plasminogen activator, showing resolution of the thrombus and filling of the intrahepatic branches. There was mild size mismatch noted at the anastomotic site (arrow) with no underlying stricture; E: Color Doppler image performed during the procedure after HA recanalization, showing normal biphasic flow inside the graft confirming absence of significant stenosis, therefore stent placement was not necessary. HA: Hepatic artery; GDA: Gastroduodenal artery.
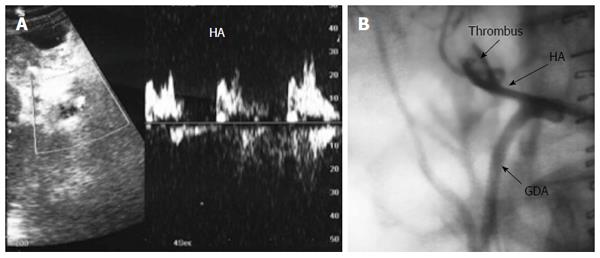
Figure 32 Post-operative hepatic artery impending thrombosis in a patient with stable liver enzymes, 3 d post-living donor liver transplantation.
A: Doppler US image, showing abnormal arterial waveform with damped irregular systole, absent and reversed diastolic flow (suspicious of impending thrombosis); B: Arterial angiography performed after 2 h showing acute thrombosis and dilatation of the recipient HA proper. Intra-arterial thrombolysis was performed successfully. HA: Hepatic artery.
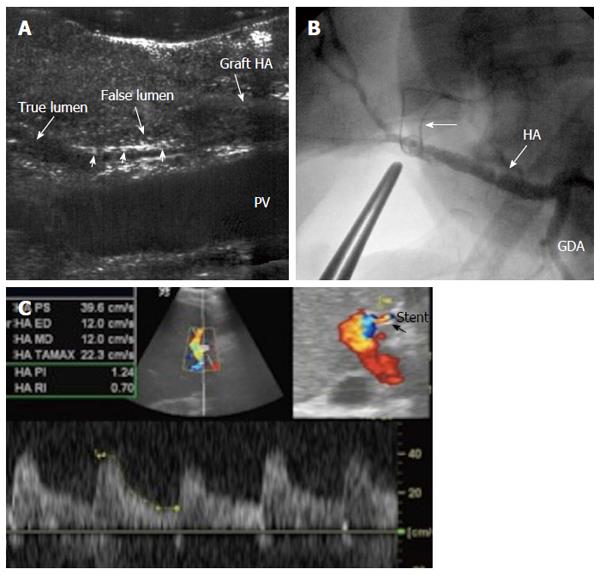
Figure 33 Intra-operative dissection of the graft hepatic artery.
A: IOUS B-mode image, showing dissecting intimal flap within the graft artery (arrow heads), the false lumen is seen echogenic and filled with blood and the flap totally occludes the true lumen. Surgical correction failed to repair the dissection; B: Hepatic arteriography image after successful hybrid endovascular stent placement, showing patent HA and good intrahepatic flow. A metallic marker was applied to mark the anastomotic site before stent placement (arrow); C: Doppler US image 4 mo later, confirmed patency of the stent with normal arterial waveform. HA: Hepatic artery.
Figure 34 Intra-operative dissection of the recipient hepatic artery.
A: IOUS B-mode image in axial and longitudinal scans, showing circumferential dissection of the recipient HA with 2 parallel echogenic intimal flaps seen within; B: Color Doppler image, showing a characteristic double-hump early presystolic pulse waveform, signifying ongoing dissection, that necessitates revision of the anastomosis. HA: Hepatic artery.
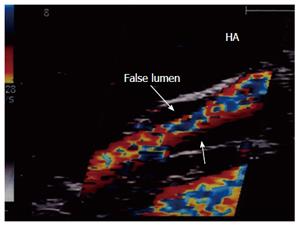
Figure 35 Intra-operative dissection of the recipient hepatic artery.
IOUS color image showing recipient HA dissection (proximal to the anastomosis). The dissection was self-limiting; a single stream flow in the true lumen and thrombosed false lumen (sealed, arrows). Therefore, revision of the anastomosis was not necessary. HA: Hepatic artery.
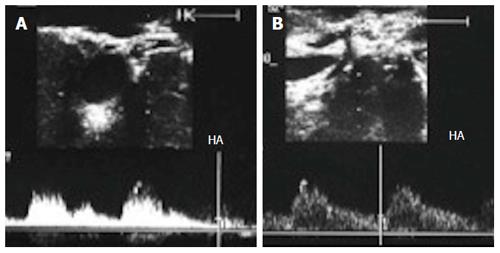
Figure 36 Gastroduodenal arterial steal.
A: Intra-operative Doppler US image showing weak flow in the recipient HA (pre-anastomotic), with damped irregular systolic peak; B: Doppler US image after experimental clamping of the gastroduodenal artery, demonstrating improvement of the arterial waveform and regaining of the sharp systolic upstroke. Ligation of the gastroduodenal artery was then performed. HA: Hepatic artery.
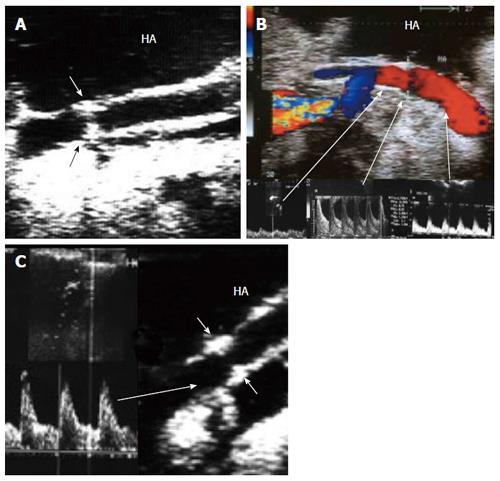
Figure 37 Intra-operative hepatic artery stenosis.
A: IOUS B-mode image revealing significant stricture at the anastomotic site (arrows); B: Color Doppler image showing anastomotic jet of the systolic and diastolic arterial flow compared to the pre-stenotic segment and dampening of the distal flow (tardus parvas waveform); C: Doppler US image distal to the anastomosis after surgical revision, revealing improvement of the distal arterial flow with normal waveform (arrows). HA: Hepatic artery.
Figure 38 Post-operative hepatic artery stenosis in a patient with persistent graft dysfunction, 2 mo post-living donor liver transplantation.
A: Doppler US image showing arterial velocity jet at the graft hilum; B: Doppler US image showing damped intra-hepatic arterial flow (tardus parvas waveform); C: MDCT angiography, volume rendering image, showing significant anastomotic stricture; D: Conventional angiography showing tight anastomotic stricture (arrow); E: Conventional angiography after stent placement (arrow); F: Doppler US image performed during the procedure showing normal intrahepatic arterial waveform after stent placement. HA: Hepatic artery.
Figure 39 Post-biopsy arterio-venous fistula.
Color Doppler image demonstrating a pulsatile portal vein branch in segment 6 subsequent to a post-biopsy arterio-venous fistula. PV: Portal vein.
- Citation: Abdelaziz O, Attia H. Doppler ultrasonography in living donor liver transplantation recipients: Intra- and post-operative vascular complications. World J Gastroenterol 2016; 22(27): 6145-6172
- URL: https://www.wjgnet.com/1007-9327/full/v22/i27/6145.htm
- DOI: https://dx.doi.org/10.3748/wjg.v22.i27.6145


