Copyright
©The Author(s) 2016.
World J Gastroenterol. Jun 28, 2016; 22(24): 5532-5539
Published online Jun 28, 2016. doi: 10.3748/wjg.v22.i24.5532
Published online Jun 28, 2016. doi: 10.3748/wjg.v22.i24.5532
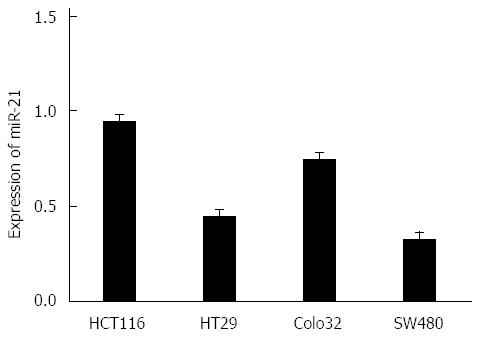
Figure 1 Expression of miR-21 in colorectal cancer cell lines (n = 3).
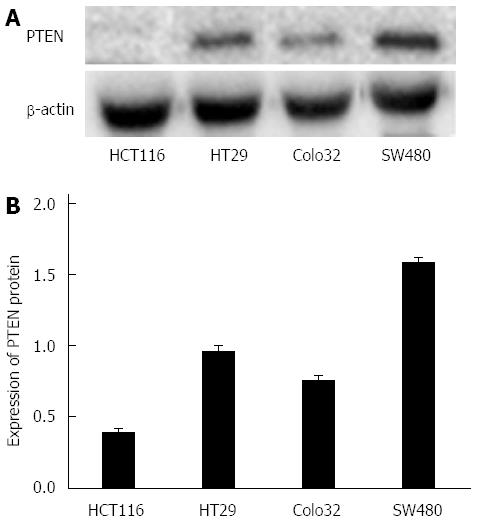
Figure 2 Expression of PTEN protein in colorectal cancer cell lines.
A: Western blot assay; B: the expression of PTEN in colorectal cancer cell lines (n = 3).
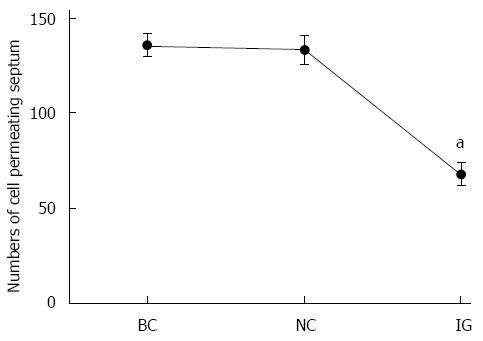
Figure 3 Changes in cell invasion ability after transfection (aP < 0.
05, n = 3). IG: Inhibition group; NC: Negative control; BC: Blank control.
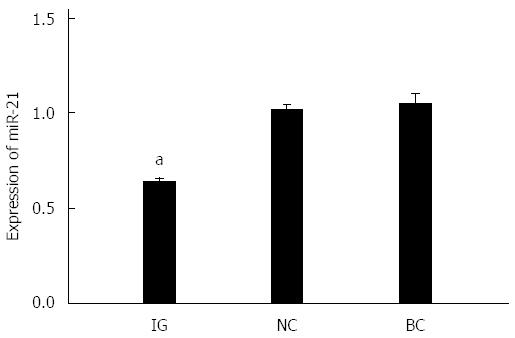
Figure 4 Effect of the miR-21 inhibitor on miR-21 expression in HCT116 cells (aP < 0.
05, n = 3). IG: Inhibition group; NC: Negative control; BC: Blank control.
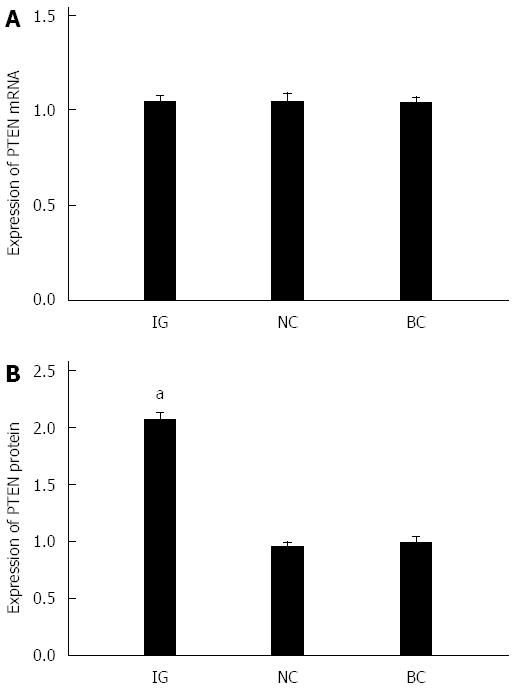
Figure 5 Effect of the miR-21 inhibitor on PTEN mRNA (A) and protein (B) expression in HCT116 cells (aP < 0.
05, n = 3). IG: Inhibition group; NC: Negative control; BC: Blank control.
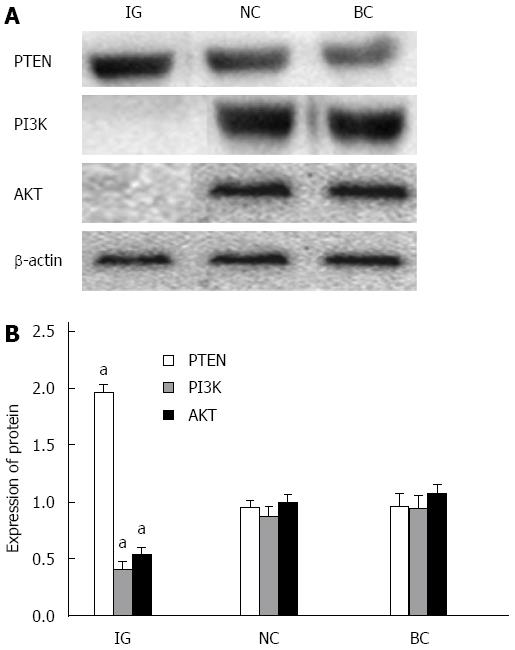
Figure 6 Protein expression of PTEN/AKT/PI3K in colorectal cancer HCT116 cell lines.
A: Western blot assay; B: Protein expression in HCT116 cell lines (aP < 0.05, n = 3). IG: Inhibition group; NC: Negative control; BC: Blank control.
- Citation: Sheng WZ, Chen YS, Tu CT, He J, Zhang B, Gao WD. MicroRNA-21 promotes phosphatase gene and protein kinase B/phosphatidylinositol 3-kinase expression in colorectal cancer. World J Gastroenterol 2016; 22(24): 5532-5539
- URL: https://www.wjgnet.com/1007-9327/full/v22/i24/5532.htm
- DOI: https://dx.doi.org/10.3748/wjg.v22.i24.5532


