Copyright
©The Author(s) 2016.
World J Gastroenterol. Jun 21, 2016; 22(23): 5406-5414
Published online Jun 21, 2016. doi: 10.3748/wjg.v22.i23.5406
Published online Jun 21, 2016. doi: 10.3748/wjg.v22.i23.5406
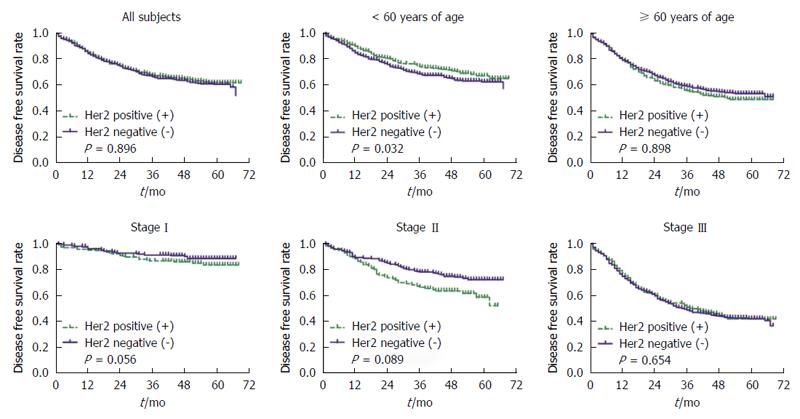
Figure 1 Kaplan-Meier survival curves for disease free survival rate stratified by categorical age (< 60 year vs≥ 60 year) and pTNM stage without adjustment, respectively.
The green dash with plus indicates the positive status of HER2, and the blue solid with plus indicates the negative status of HER2. HER2: Human epidermal growth receptor 2.
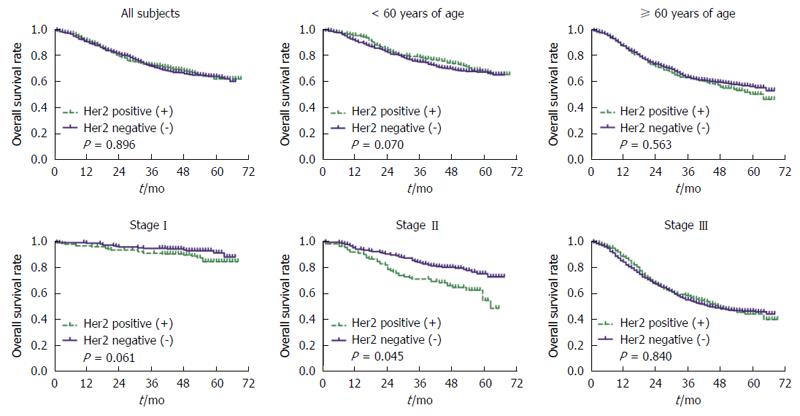
Figure 2 Kaplan-Meier survival curves for overall survival rate stratified by categorical age (< 60 year vs≥ 60 year) and pTNM stage without adjustment, respectively.
The green dash with plus indicates the positive status of HER2, and the blue solid with plus indicates the negative status of HER2. HER2: Human epidermal growth receptor 2.
- Citation: Shen GS, Zhao JD, Zhao JH, Ma XF, Du F, Kan J, Ji FX, Ma F, Zheng FC, Wang ZY, Xu BH. Association of HER2 status with prognosis in gastric cancer patients undergoing R0 resection: A large-scale multicenter study in China. World J Gastroenterol 2016; 22(23): 5406-5414
- URL: https://www.wjgnet.com/1007-9327/full/v22/i23/5406.htm
- DOI: https://dx.doi.org/10.3748/wjg.v22.i23.5406


